

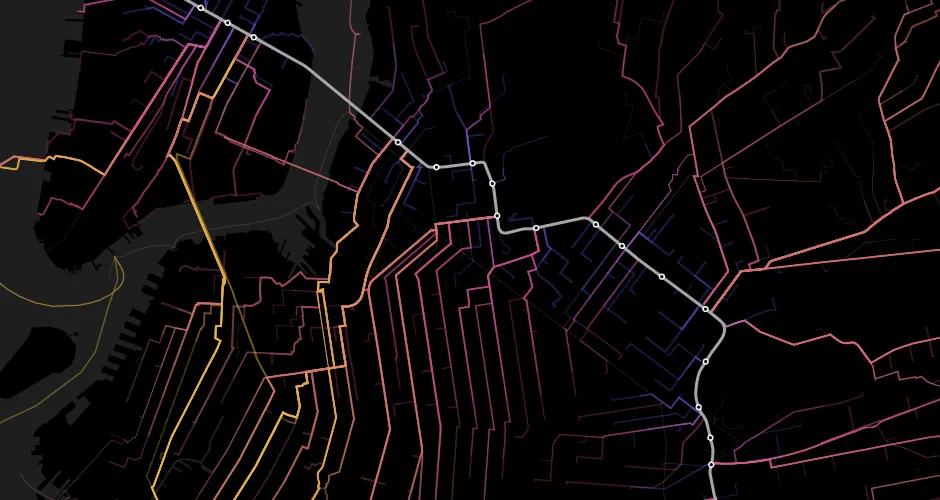
The L Train closure—what data can tell us
Discover insights from NYC's L Train closure analysis. Explore how data visualization reveals transit trends, community impacts, and planning solutions.
Discover insights from NYC's L Train closure analysis. Explore how data visualization reveals transit trends, community impacts, and planning solutions.
Vote for CartoDB's sessions at FOSS4G-NA 2016! Explore Python, Urban Scratchoff, Big Metadata, Information Commons, Decision Making Data, and Dynamic Maps.
Discover the highlights of CartoDB's Partner Summit, featuring insights from industry leaders. Explore the future trends in location intelligence.