

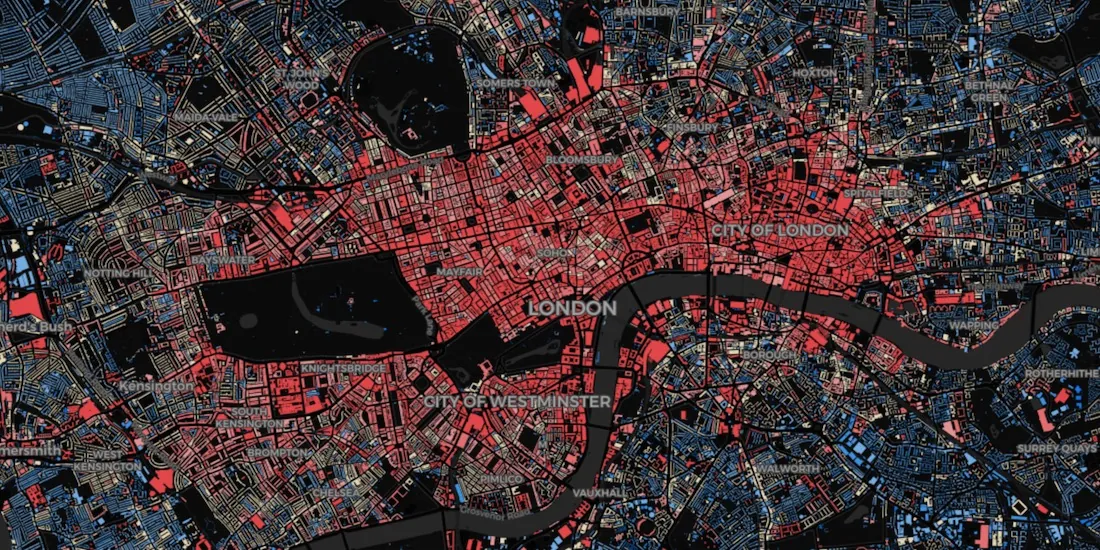
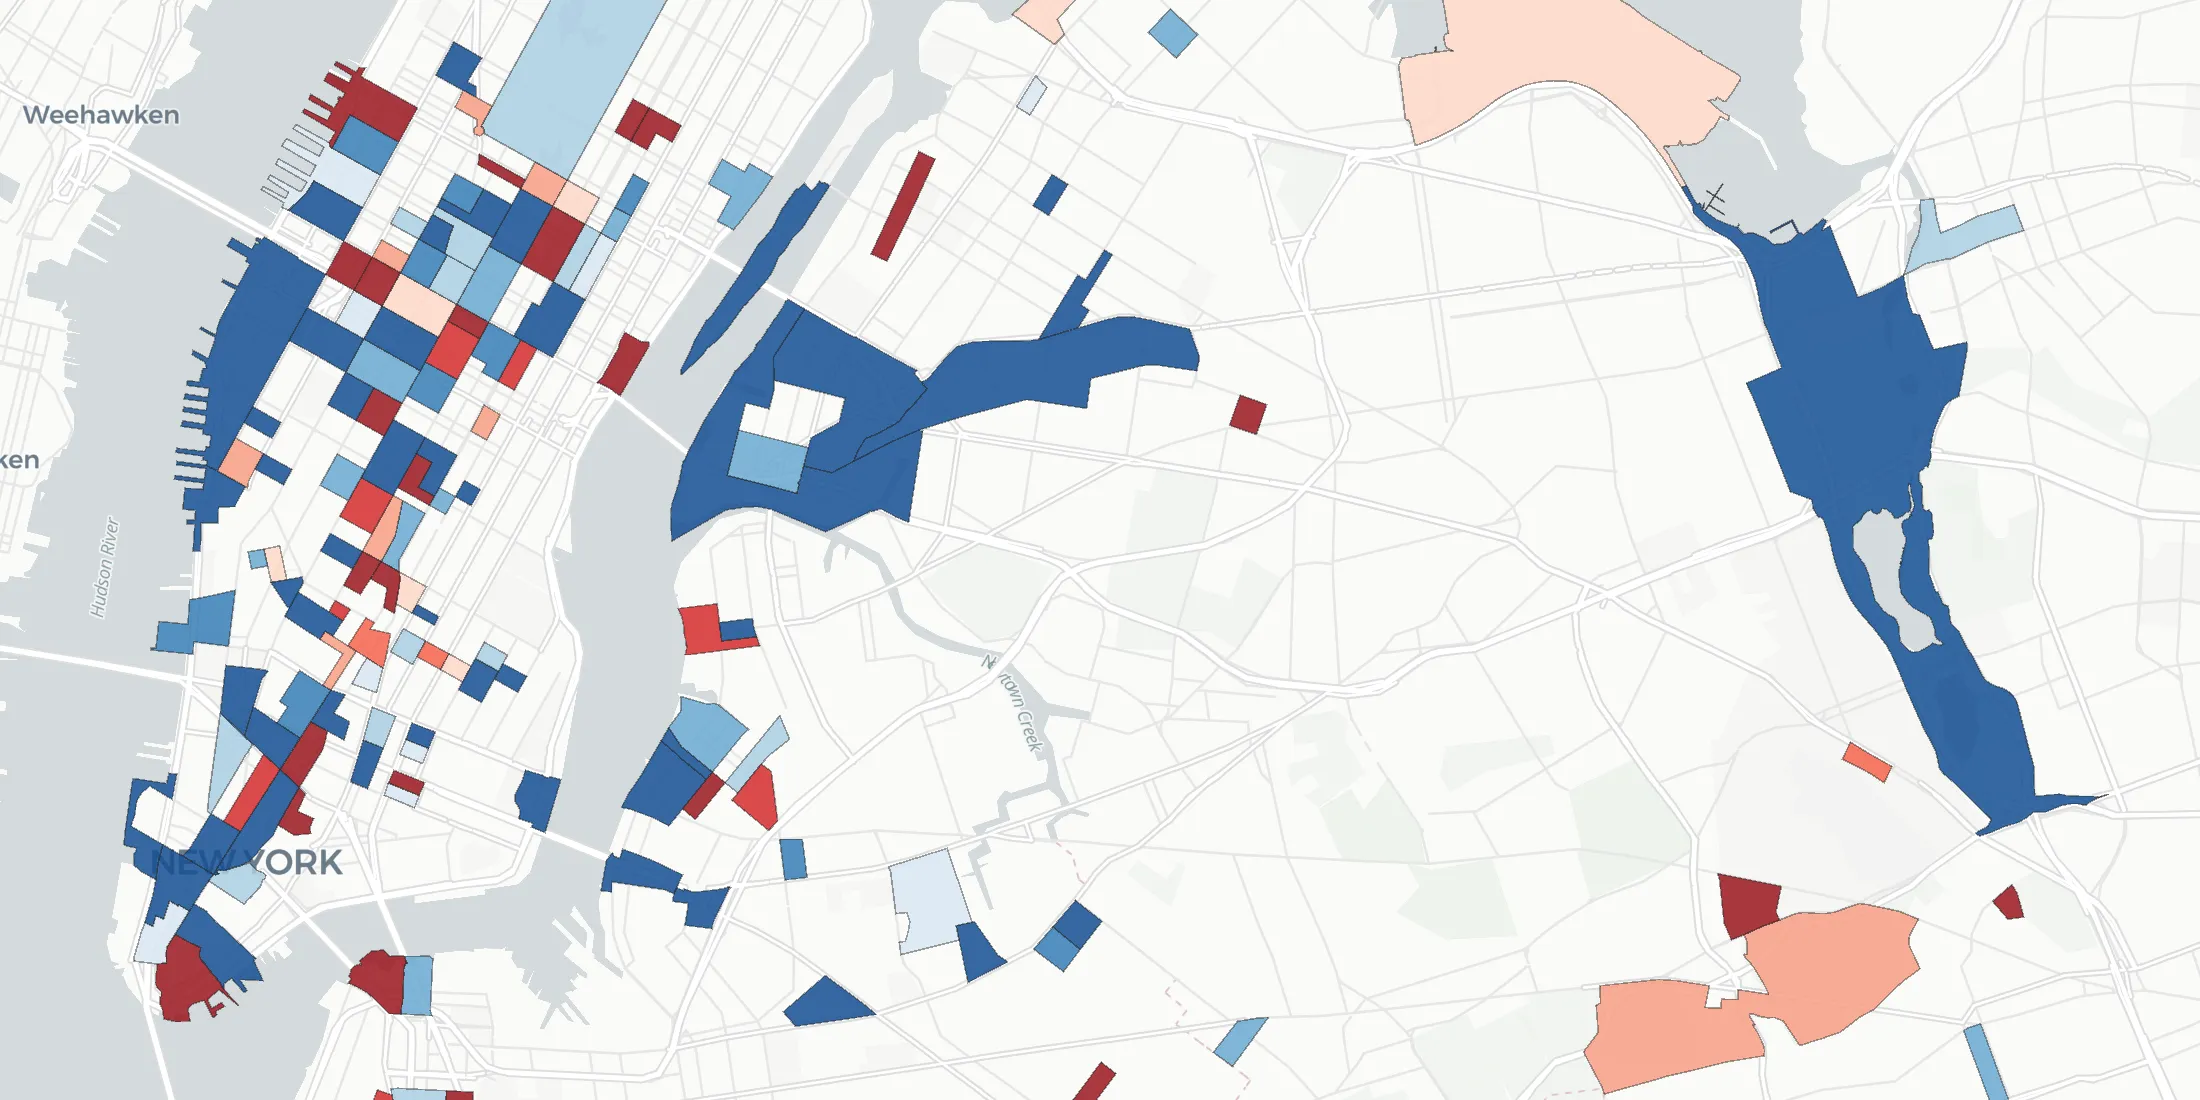
London vs New York: Which city has the higher average building height?
The City vs Wall Street. Piccadilly Circus vs Times Square. The answer will surprise you as we discover through maps & visualization.
The City vs Wall Street. Piccadilly Circus vs Times Square. The answer will surprise you as we discover through maps & visualization.
Explore how to use our Google BigQuery connector to import large public datasets for geospatial analysis.

A look at how spatial analysis & new data streams such as telco & credit card data can provide insights in a return to retail post COVID-19.
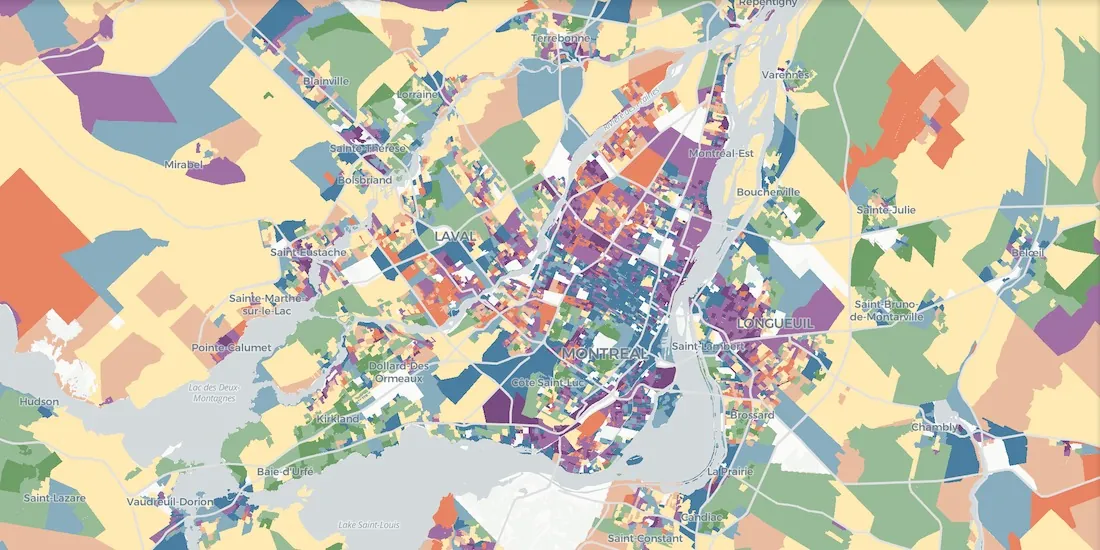
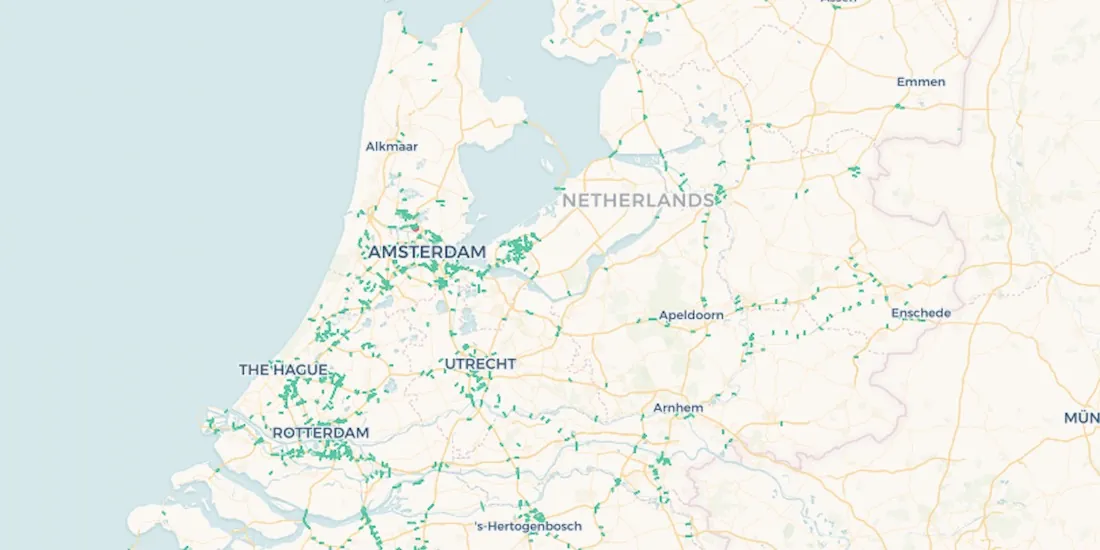
Learn more about Geometric, a Geomarketing solution for Online Retailers made by Anagraph & their work creating COVID-19 dashboards for Canada.
Read how the Center on Rural Innovation & others used CARTO to determine which rural communities in the US are in need of greater support against COVID-19.
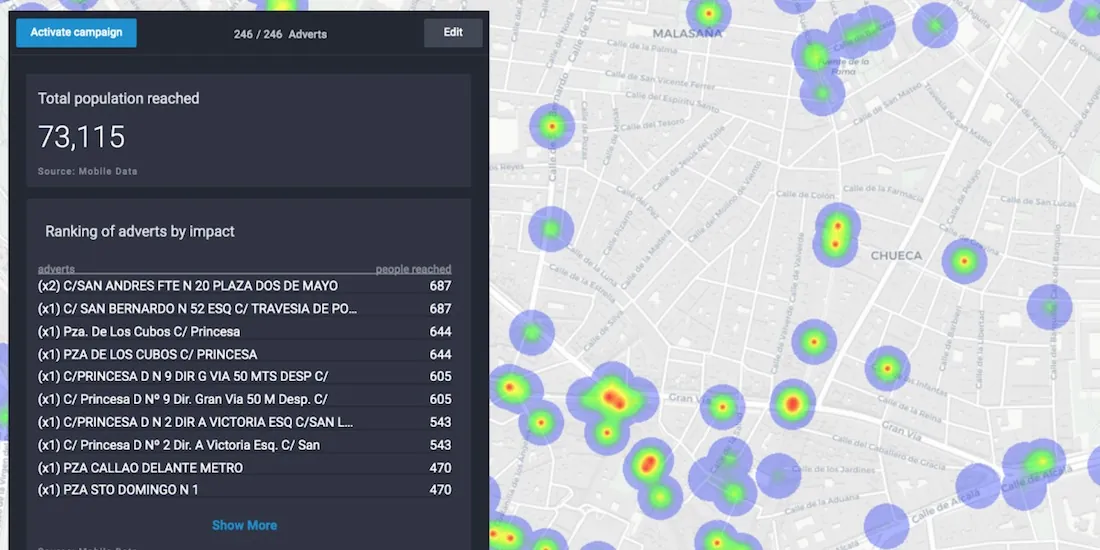
A look at the impact of COVID-19 on OOH & how geospatial solutions can be used in the post pandemic recovery of the industry.

CARTO makes available a set of COVID-19 related datasets as public data in the Data Observatory v2.0

Leaders in data collection & spatial analysis come together to enable organizations to overcome the coronavirus through grants program.
Geosocial Data is now available in CARTO through our partnership with Spatial.ai. See how location-based social media data can be used in spatial analysis.
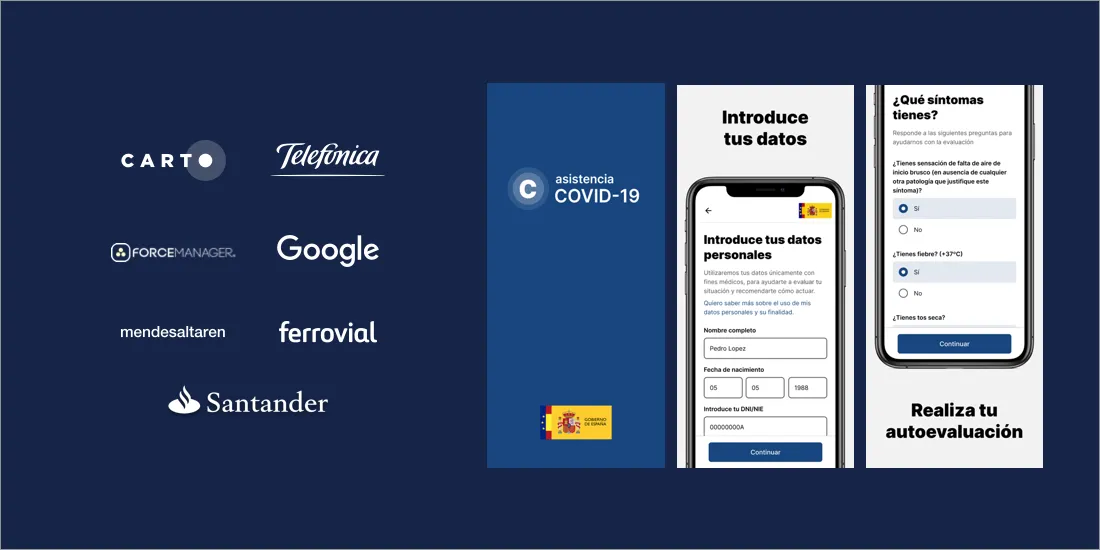
AsistenciaCOVID-19, the self diagnosis app which CARTO is collaborating on, is now available in five new regions of Spain.