

How to Visualize Urban Growth with Spatial Analytics in BigQuery
How has your city or urban area grown? Discover how to create an Urban Growth visualization using open data & CARTO's Spatial Analytics in BigQuery.
How has your city or urban area grown? Discover how to create an Urban Growth visualization using open data & CARTO's Spatial Analytics in BigQuery.
Access your location based datasets from the CARTO Data Observatory directly on leading cloud platforms, including Google Cloud, AWS, and Azure
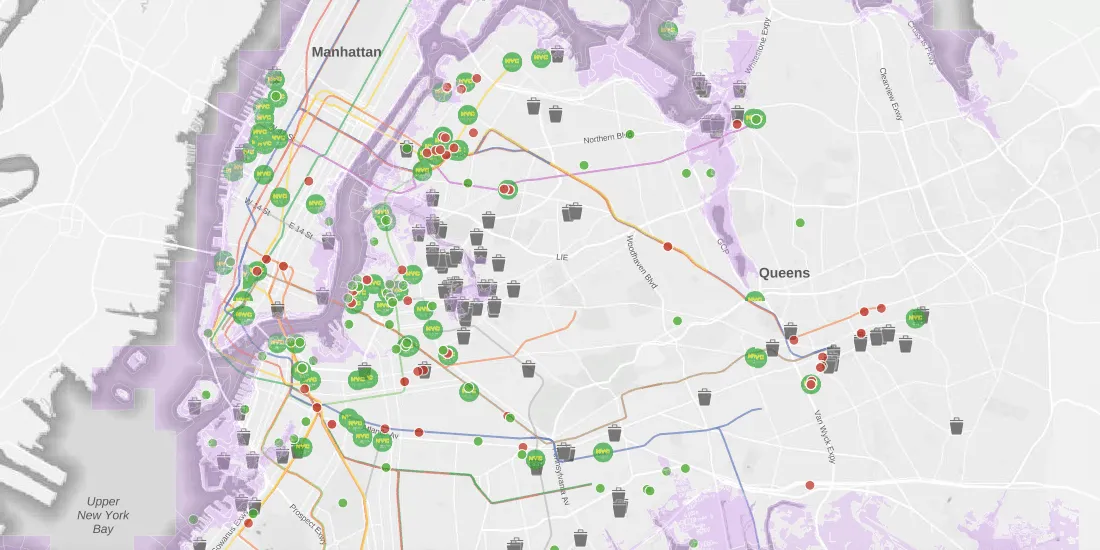
Learn about SPEED 2.0, a collection of spatial datasets wrapped into one app for the purpose of helping individuals identify environmental issues in New York City

CARTO will be attending Mobile World Congress MWC21 Barcelona to discuss how location data can be used in a wide range of telecoms use cases.
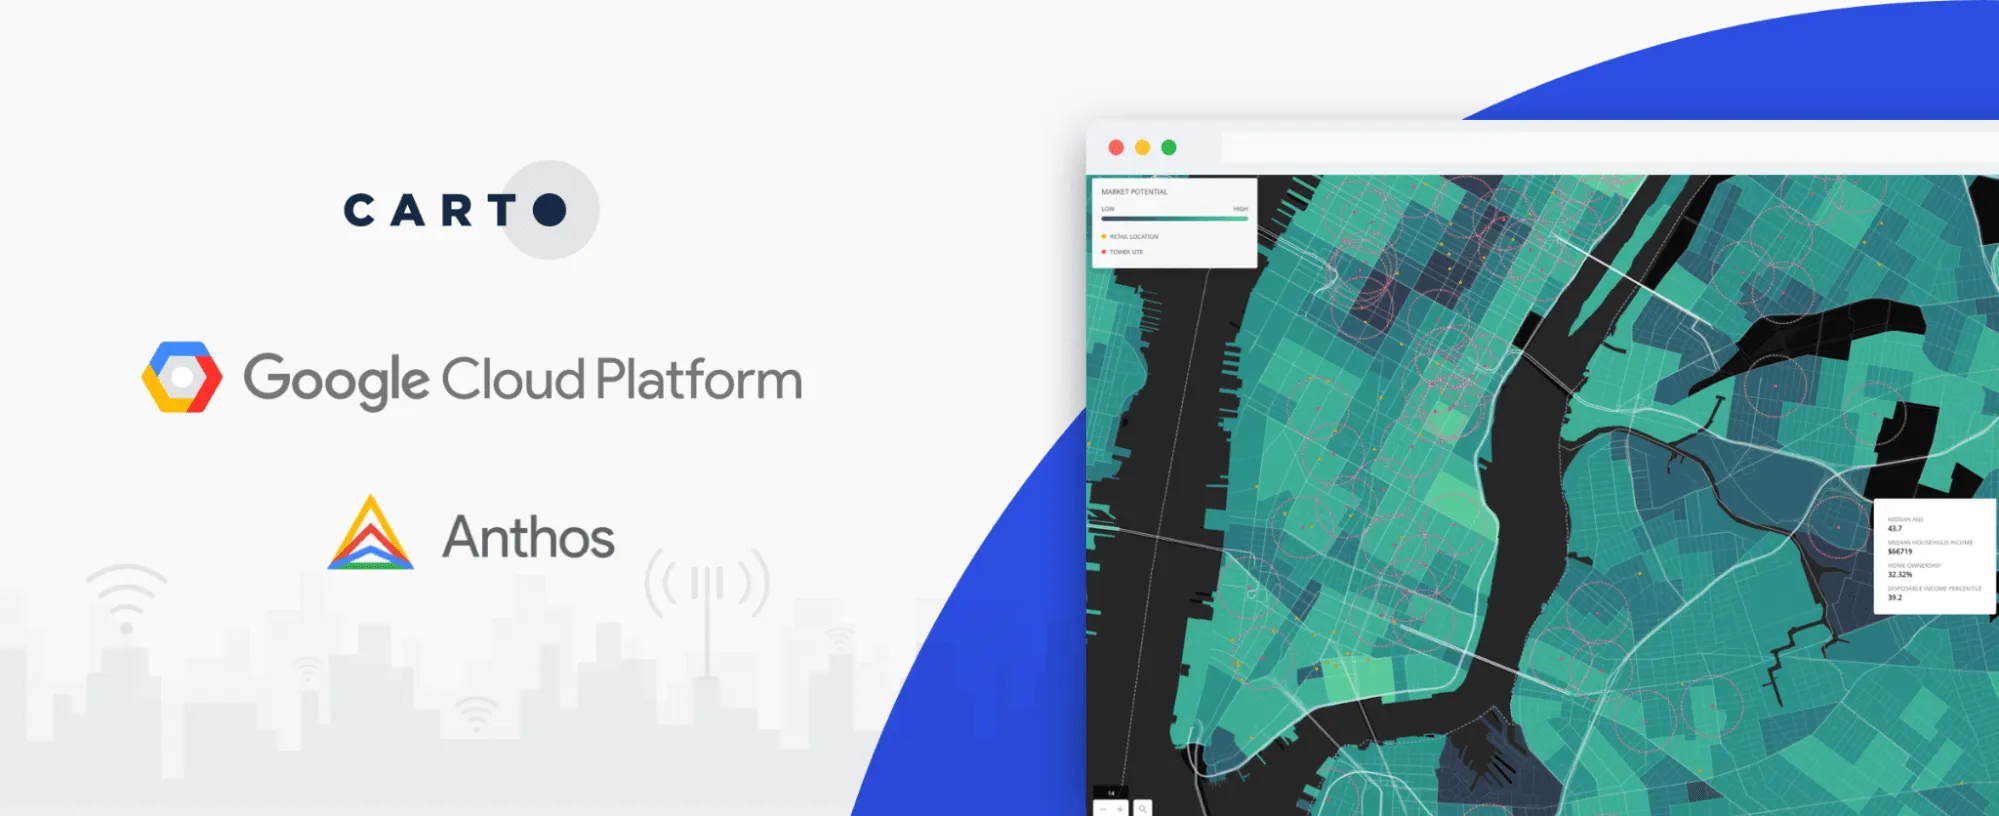
As part of Google Cloud’s initiative to bring partner solutions to the network edge, we’re delighted to announce CARTO has been listed as a strategic partner.

Hand washing is key in the fight against COVID-19 but in Brazil water access can be an issue. Discover how Location Intelligence can be used to analyze the impact.
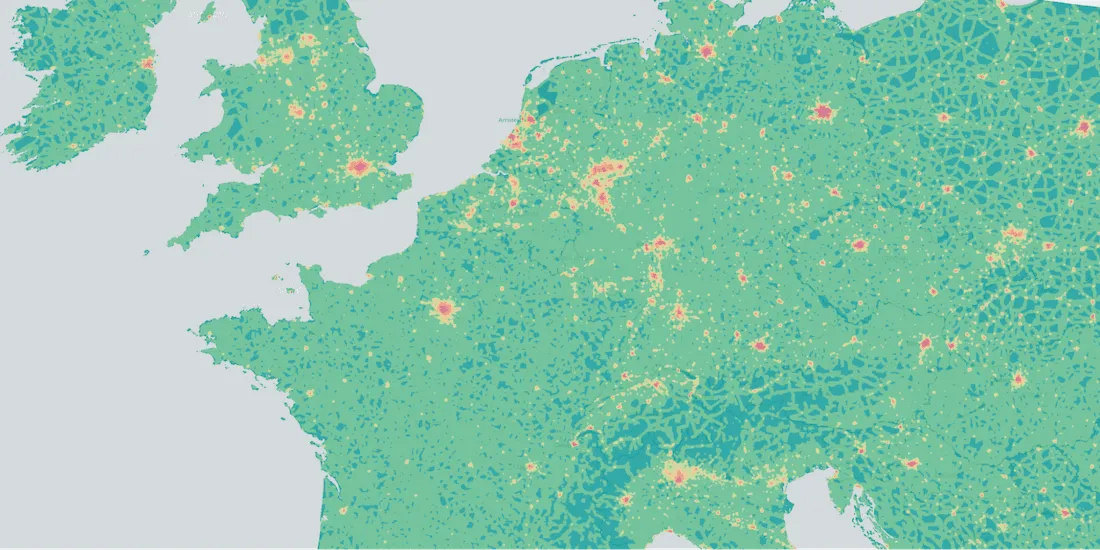
How can we measure levels of urbanity? Learn how our team designed a spatial model able to classify urbanity levels globally & with high granularity

Want to develop spatial apps with Angular & CARTO? Check out our guide to see how easy it is to integrate Angular applications with CARTO for deck.gl
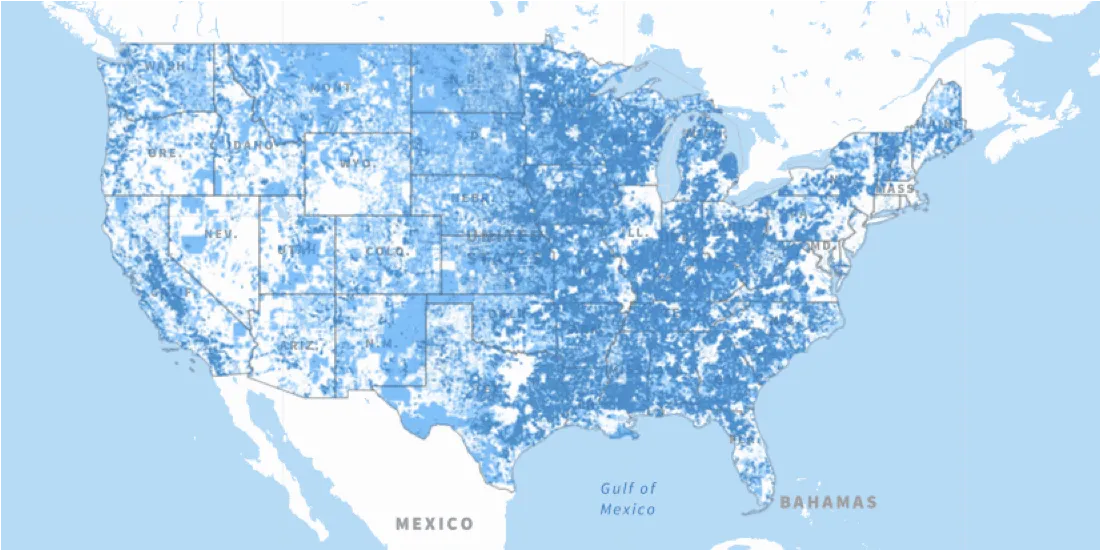
The Connect America Fund aims to close the digital divide between rural & urban America. Learn more about it's impact with a newly updated map from the USAC.

Discover how Vital Village Network & Boston Medical Center use Location Intelligence & Open Data to promote family & community safety within Boston