


Pie Charts: An Effective Data Visualization Tool?
A guide to creating Pie Charts for effective spatial Data Visualization & dashboards, including best practice and examples.
A guide to creating Pie Charts for effective spatial Data Visualization & dashboards, including best practice and examples.

Discover how spatial analysis of crime data can be used for smarter home insurance decisions, including personalized underwriting & targeted marketing.
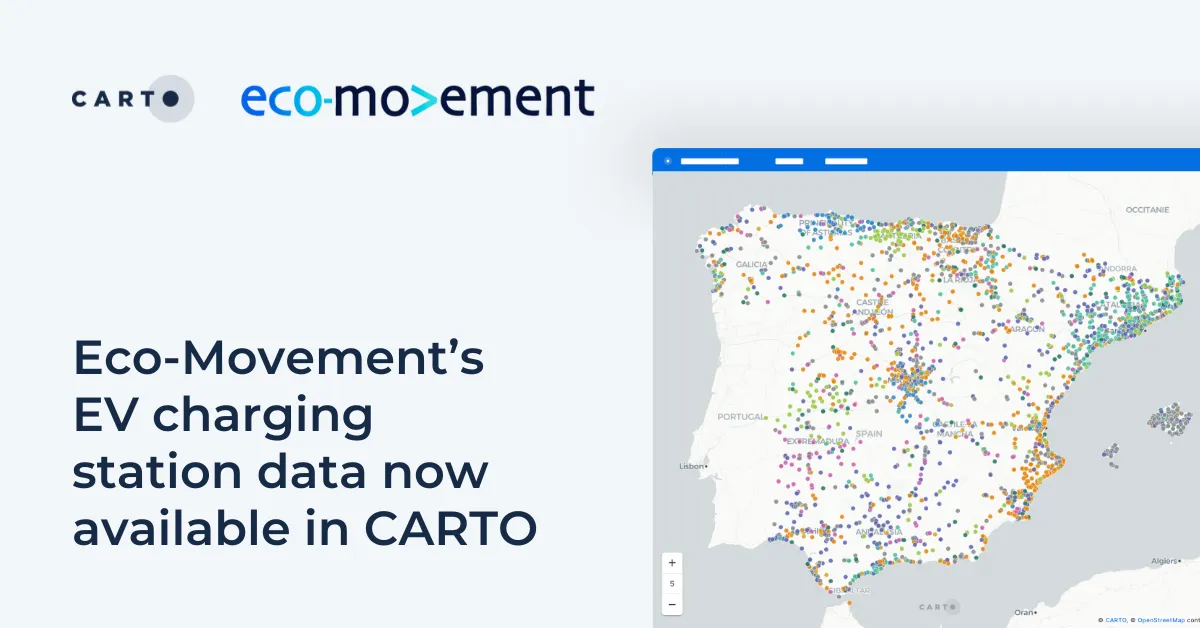
Drive insights with Eco-Movement's EV charging data - available in CARTO! Learn to use this data to optimize infrastructure & make informed decisions.

Accelerate cloud native spatial app development with CARTO. Discover our APIs and developer frameworks, built for the modern geospatial data stack.
Accelerate cloud native spatial app development with CARTO. Discover our APIs and developer frameworks, built for the modern geospatial data stack.
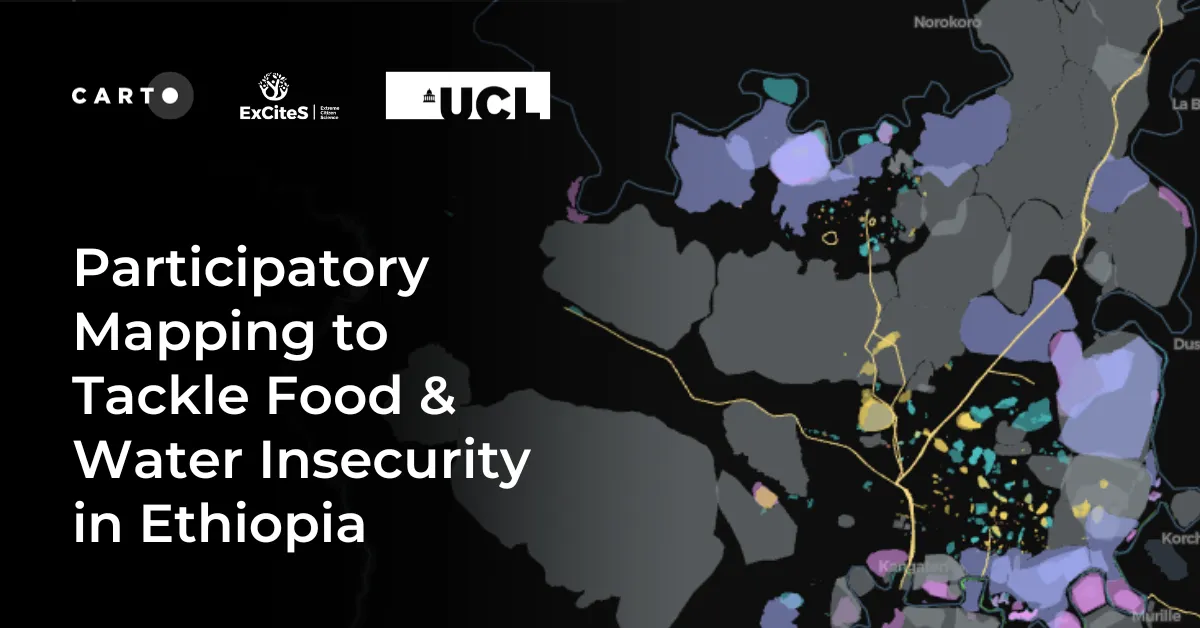
Learn about UCL ExCiteS' ground-level approach to co-create tools and methods with local communities to map and monitor their land.
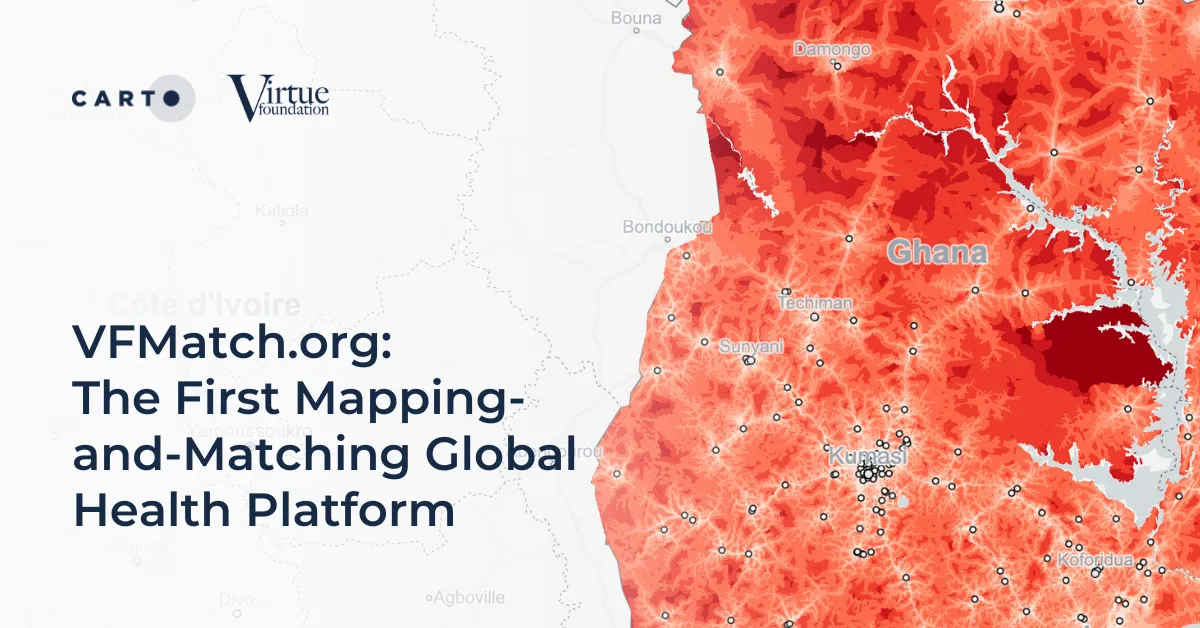
Learn about the pioneering platform VFMatch.org which harnesses the transformative potential of geospatial data in healthcare.

CARTO Q3 2023 Update: learn about new spatial analytics & data visualization features including enhancements to workflows, SQL parameters & more.

Elevate cloud-native mapping of big data with CARTO's Dynamic Tiling. Seamlessly integrate interactive maps in your apps without compromising speed.

Make decisions more efficiently with SQL parameters. Follow this step-by-step guide exploring data-driven insights from Citi Bike analytics.