With Mapbox announcing a change in their licensing this week, we share our thoughts on this news, basemap neutrality, & the future of spatial app development
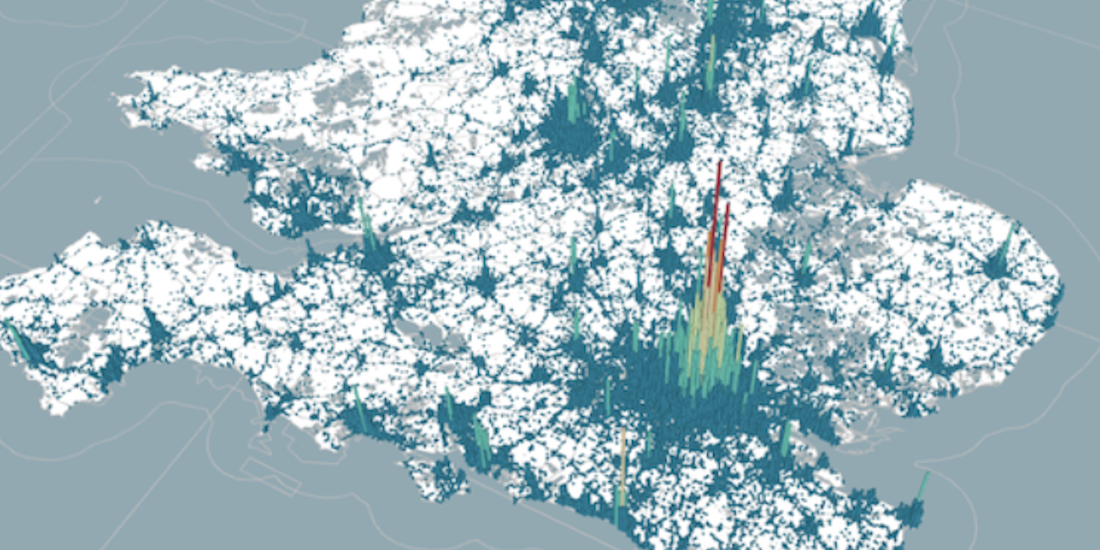
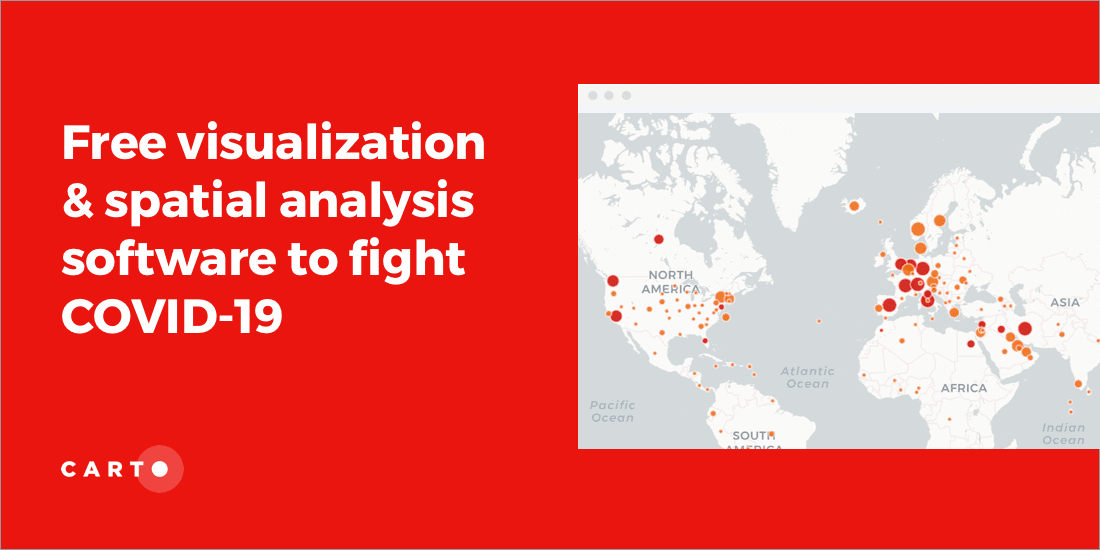
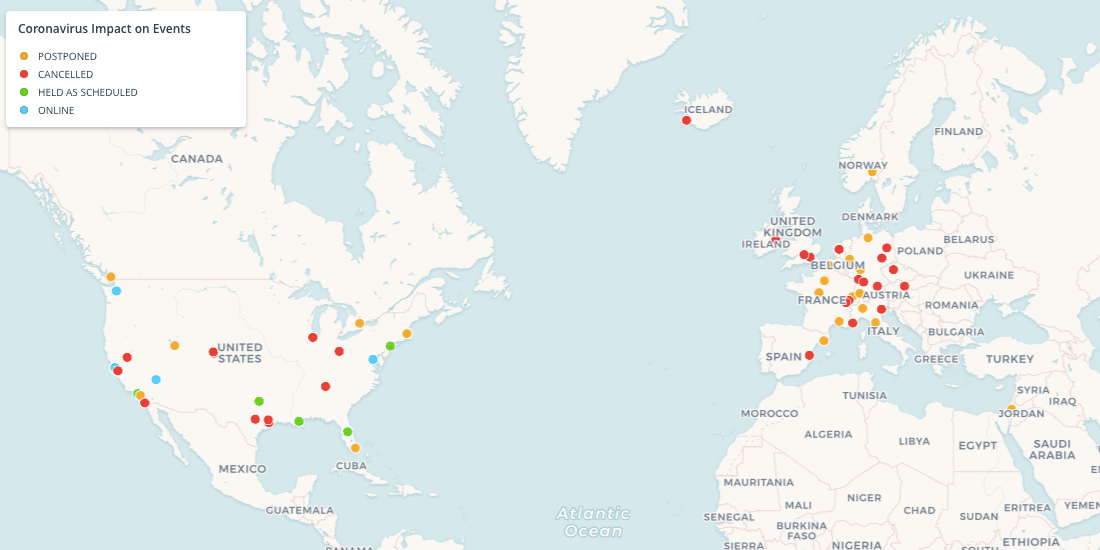
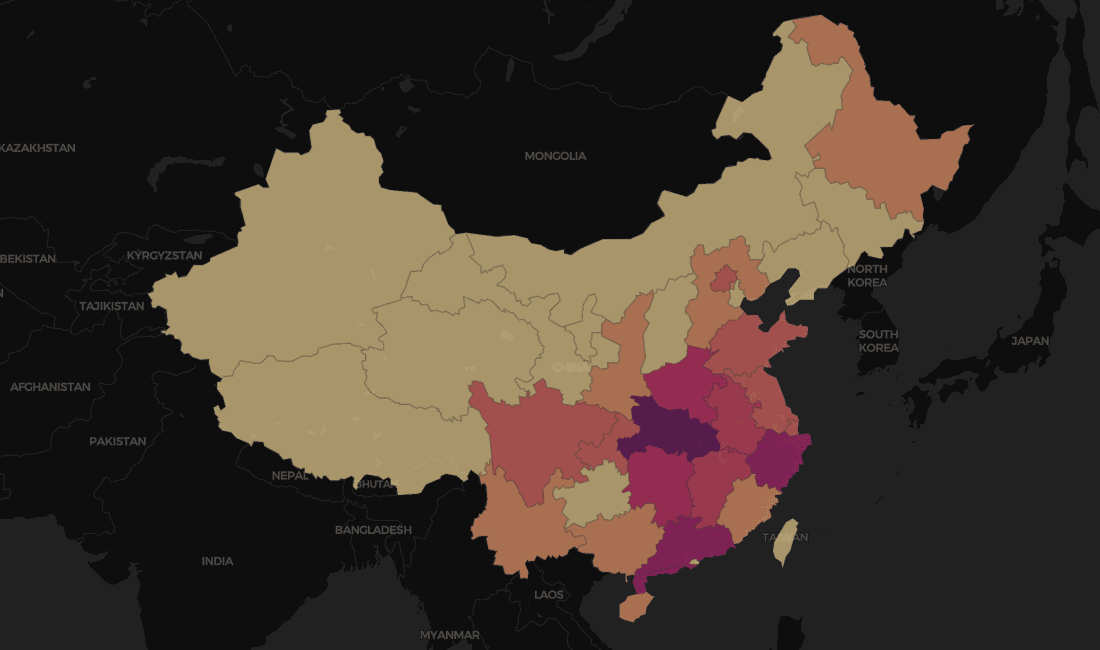
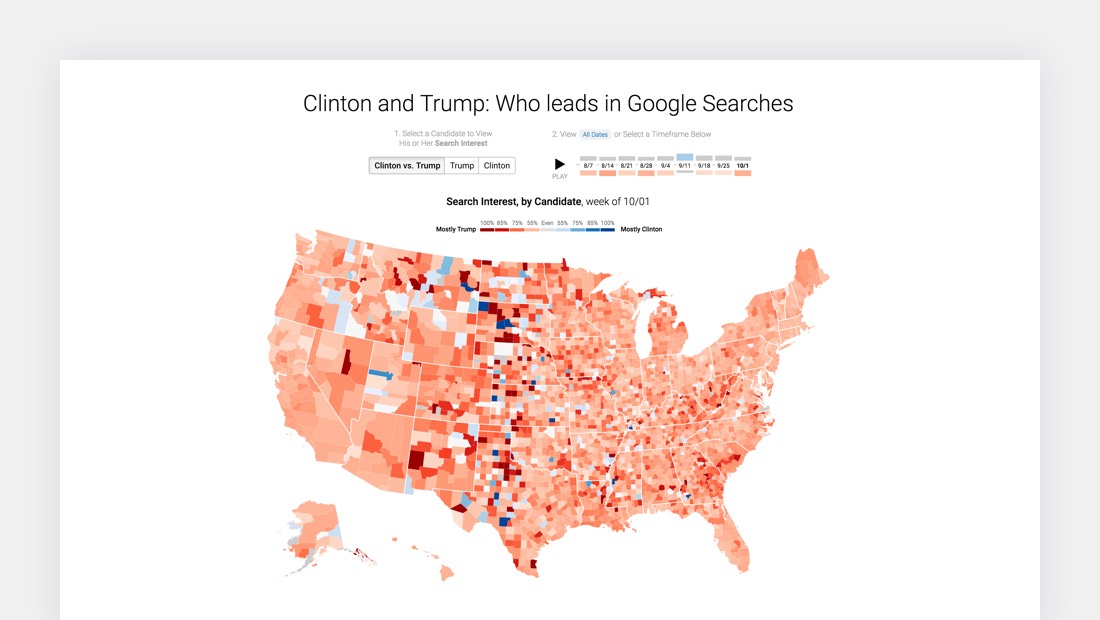
Visualizing data in emergency situations, like the spread of coronavirus, can provide decision makers with the insight needed to inform rapid response plans.
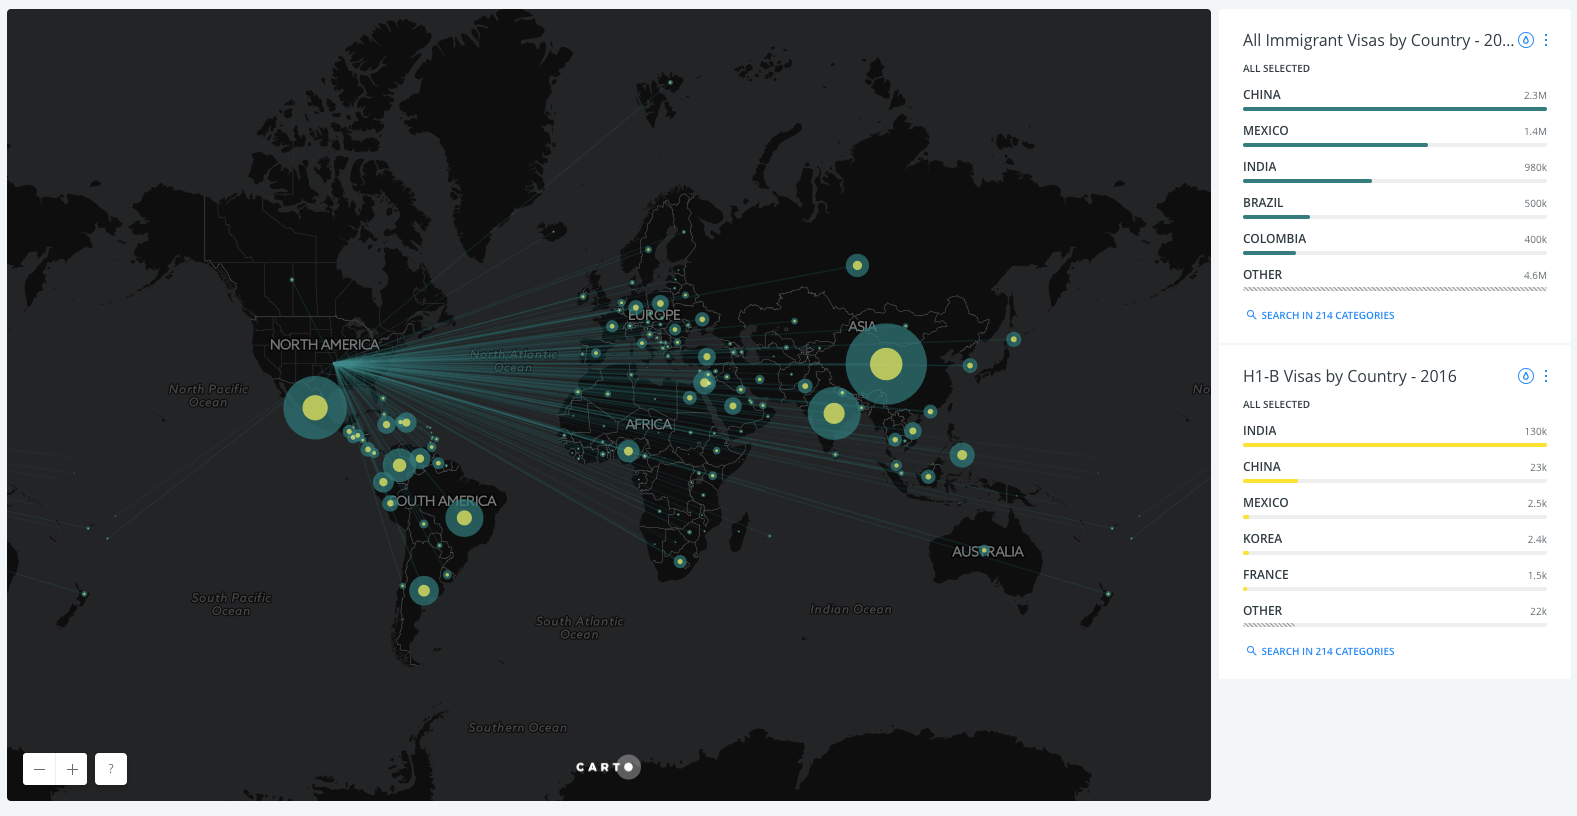
USCIS started accepting 2018 H-1B Visa applications in 2017. Explore potential impacts of the proposed H.R.670 bill on the tech industry and American economy.
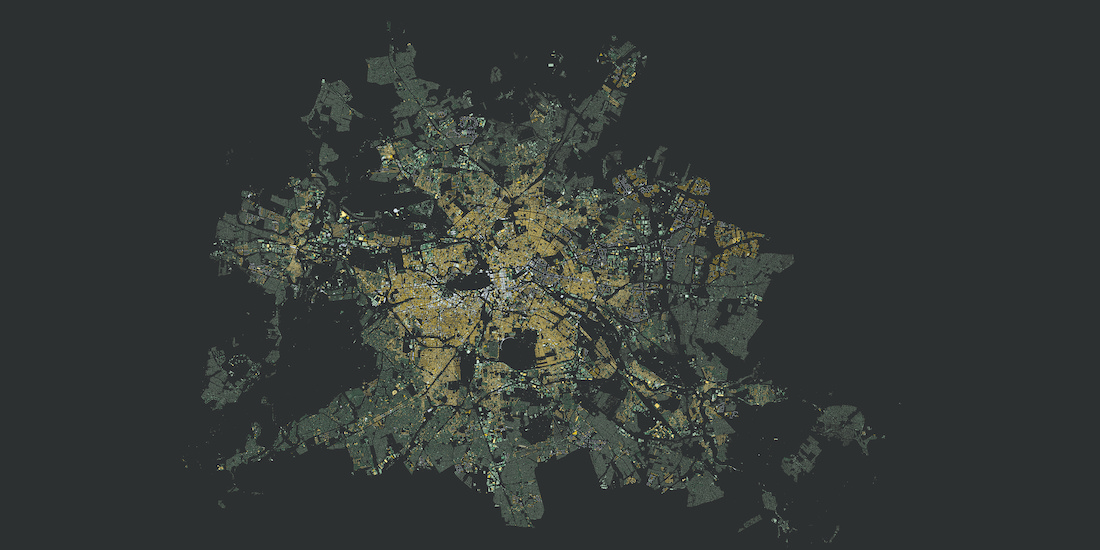
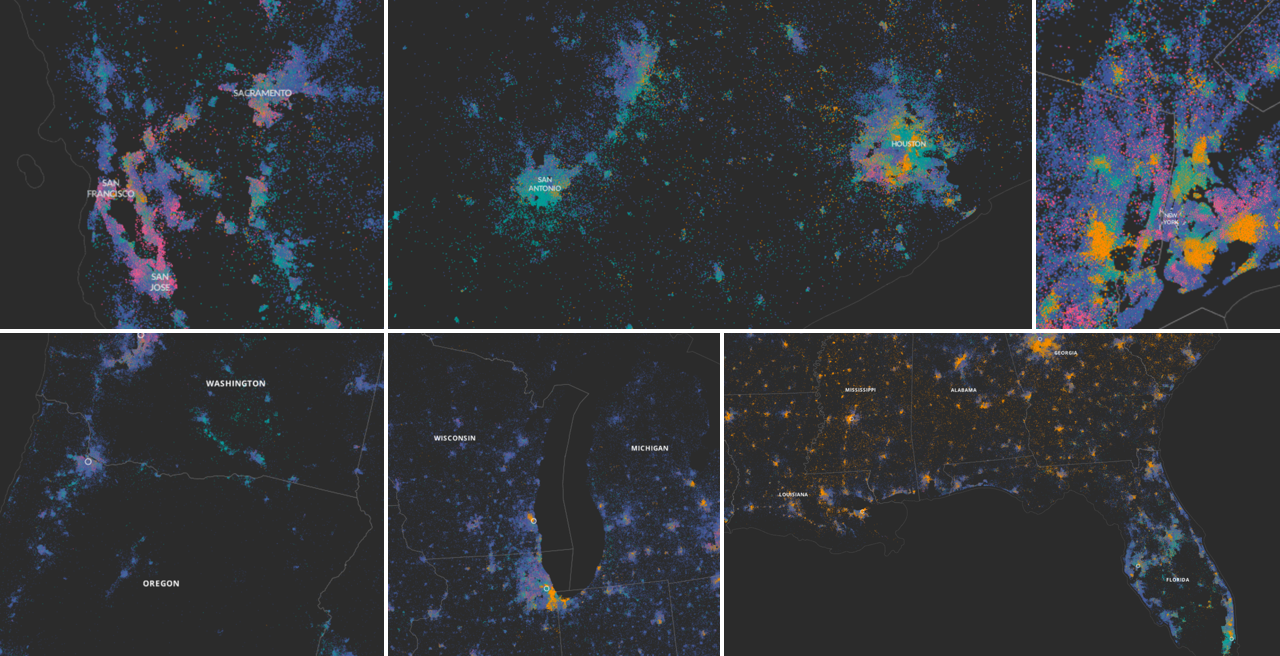
Learn dot density visualization & more spatial data techniques in our latest blog post. Explore the ethnic diversity of the US with SQL.
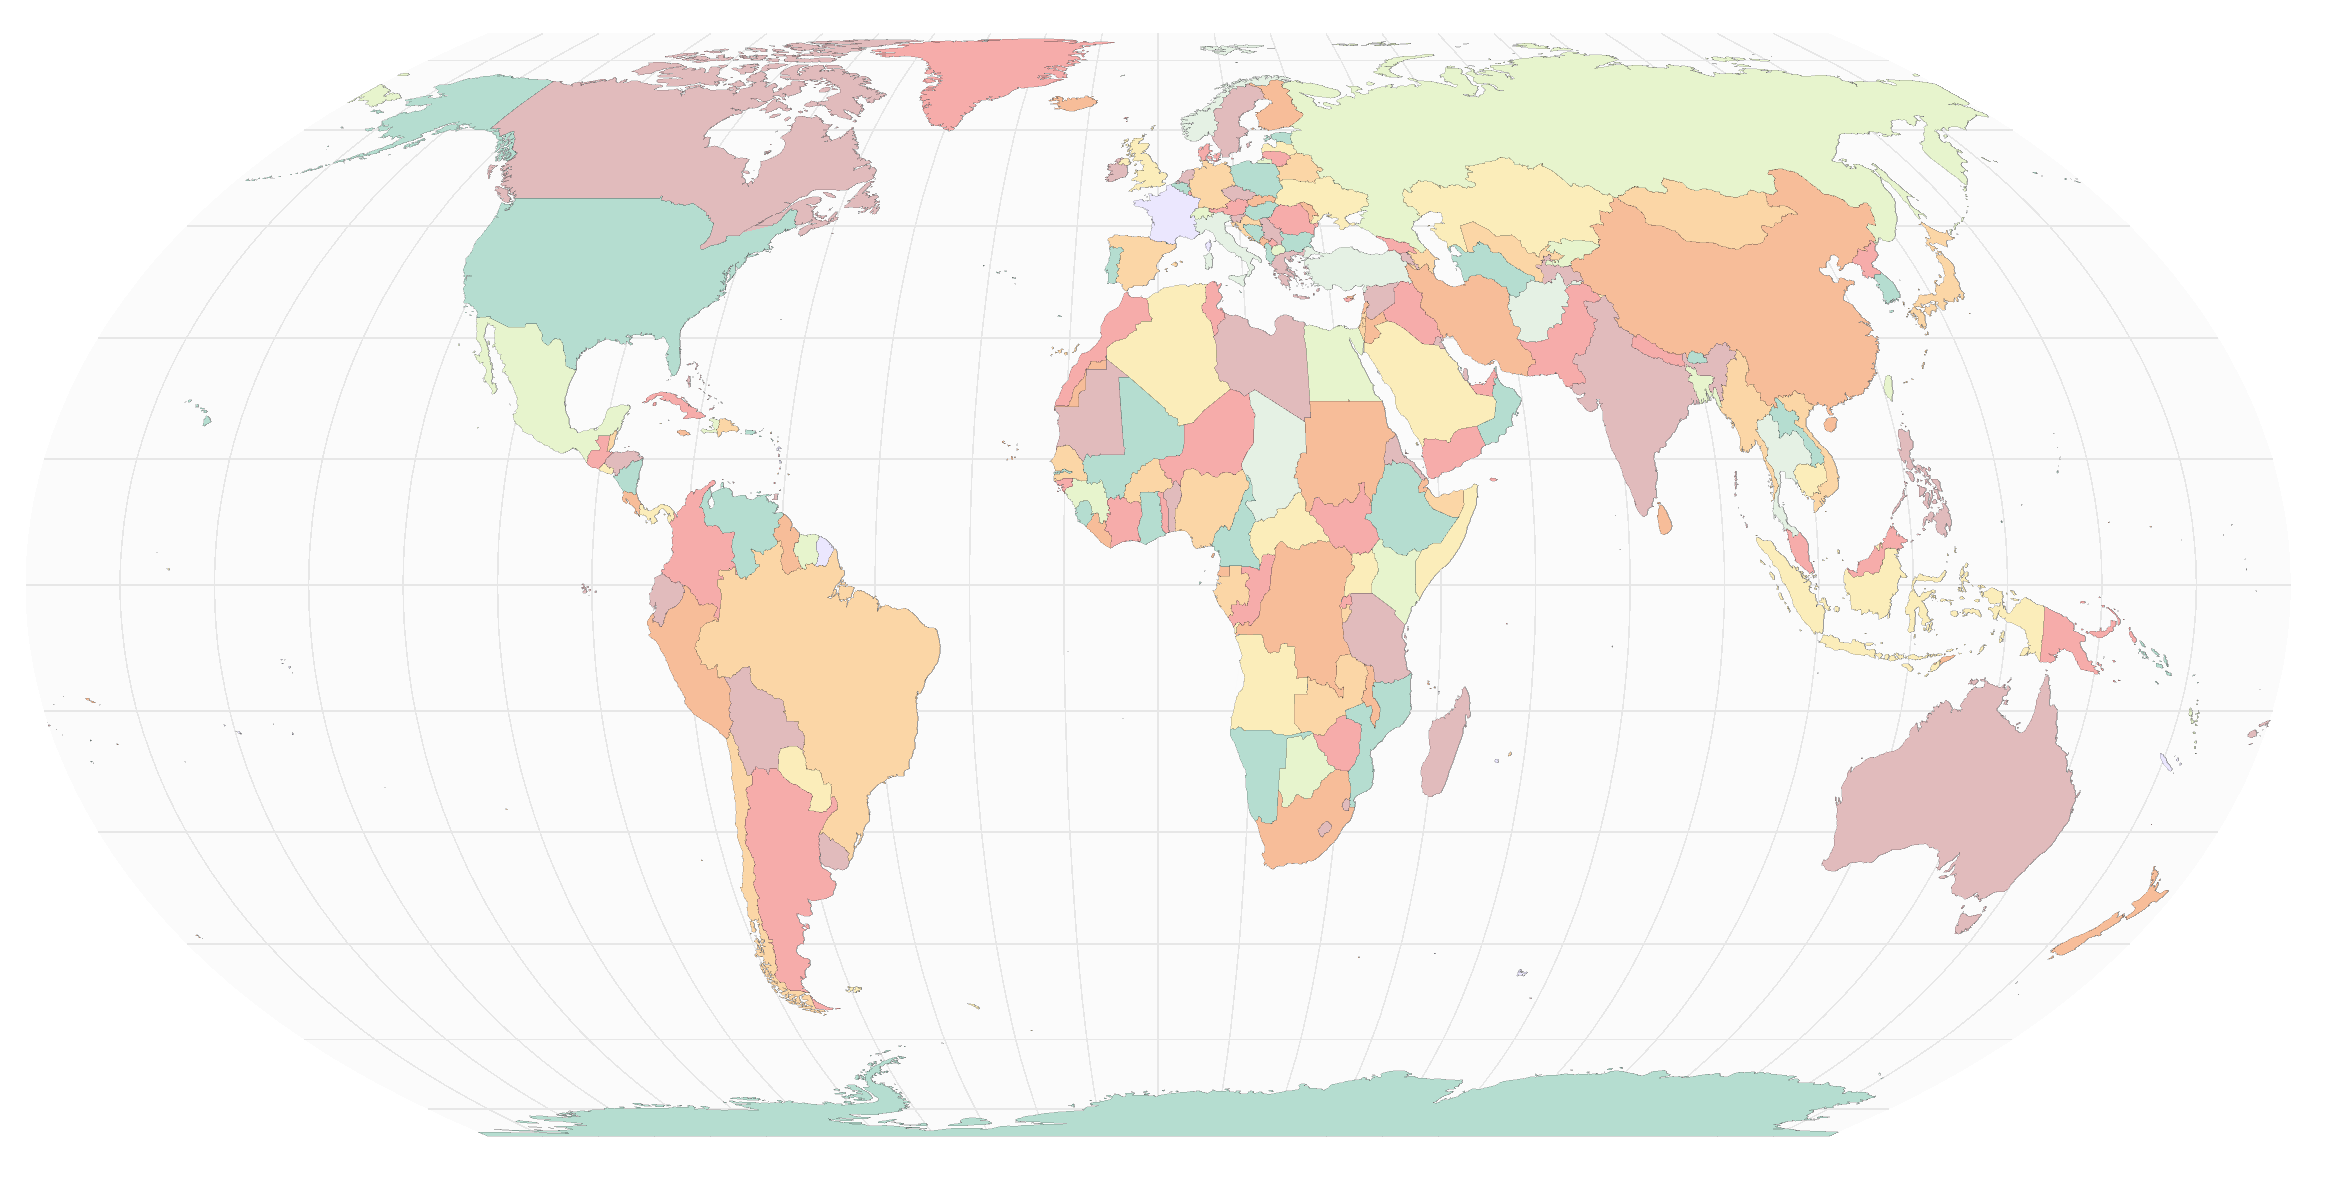
Cartography & Visualization
By clicking "Accept All Cookies", you agree to the storing of cookies on your device to enhance site navigation, analyze site usage, and assist in our marketing efforts.