3 ways Location Intelligence is changing outdoor advertising


The outdoor advertising industry has always had a location problem. Not a lack of it, but too much of it, poorly used.
For decades, OOH teams have sold on footfall estimates and proximity. "This billboard reaches 2 million people a week." But who are those people? When do they pass by? Do any of them actually buy the product? These are spatial analytics questions, and for most of the industry's history, they've been answered with gut feel and census data blended in spreadsheets.
That's changing fast. The teams winning in OOH today (in both inventory sales and campaign planning) are those who've built a modern spatial analytics stack. Not just because the data is better, but because the tooling has finally caught up: cloud-native platforms that let you analyze billions of location signals without moving your data, democratizing spatial skills, and without a six-month implementation project.
billups, VIOOH, Clear Channel and Choreograph are a few examples of what this looks like in practice. Here are three trends shaping how the smartest OOH operators are using Location Intelligence right now.
Trend 1: First-party spatial pipelines are replacing third-party data dependency
For years, OOH companies compensated for their data blind spots by buying third-party audience data: mobility signals from telcos, footfall estimates from data brokers, demographic overlays from credit bureaus. That still matters, but the competitive edge has shifted.
The teams pulling ahead are building first-party spatial pipelines: connecting their own inventory data, historical campaign performance, and client CRM data to a cloud data warehouse, then enriching it with external sources, all in one place, with no data movement.
The core advantage of a cloud-native approach: analysis runs inside your data warehouse in minutes, with data never leaving your governed environment. And instead of one-off analyses, you build CARTO Workflows that run on a schedule, ingesting new mobility data, re-scoring your inventory, and refreshing dashboards your sales team can act on. This approach removes the analyst bottleneck and stale reports.
According to CARTO's own customer data, one leading global media and advertising customer saw a 20% reduction in data ingestion time after implementing CARTO, freeing their data analysts to focus on new capabilities rather than pipeline maintenance.
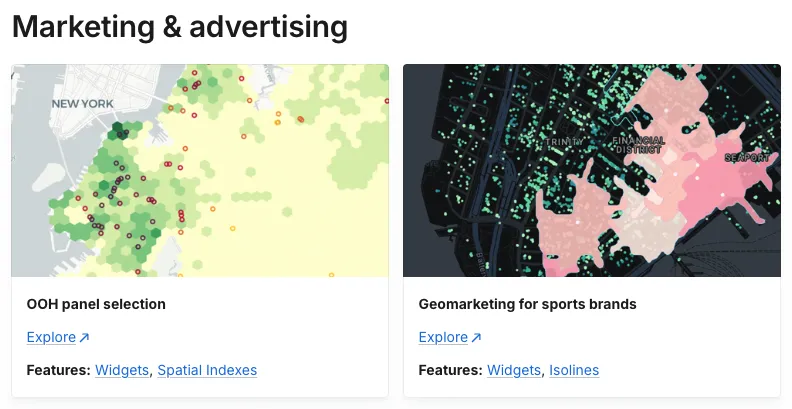
Want to see what this looks like visually? The CARTO Map Gallery includes examples of widget-driven dashboards and hotspot analysis maps, the same patterns OOH teams are applying to inventory scoring and audience analysis today.
Trend 2: Spatial analytics is becoming a client-facing competitive advantage
One of the most underrated shifts in OOH is that spatial analysis is no longer just an internal planning tool. It's becoming a core part of how agencies and operators demonstrate value to clients.
Tyler Kappen, Global Data Strategy Director at billups, put it this way:
"CARTO enables us to bring our strategy to life, making complex geospatial data simple, visual, and persuasive. It's helped us deliver better outcomes to clients and make faster, smarter campaign decisions."
That word, persuasive, matters. Showing a client a live, interactive map of audience movement around their campaign inventory, filtered by time of day, demographic segment, or travel mode, is a fundamentally different sales conversation than a PDF with impression estimates. It's also a stickier one.
CARTO Builder makes this accessible to non-GIS users. Media planners can build and share maps with clients directly, with widget-driven filtering, tooltip interactions, and secure embedding in client portals or reports.
The numbers back this up. One leading global media and advertising customer reported that 87% of brands now receive CARTO-powered visualizations in their sales presentations, strategy reviews, and performance reports. Another reported that 80% of visualizations are now created independently by media teams, cutting dependence on specialized data analysts, and that CARTO became a key differentiator in client retention.
With AI Agents, OOH analysts can go further still, querying inventory data through a natural language interface with no SQL required. Ask: "Which of our DOOH units in Manhattan have the highest foot traffic from commuters between 7 and 9am on weekdays?" The agent queries your data warehouse, generates the matching layer, and surfaces the answer directly in the map. Insights that used to take a data team days can now be generated on the spot, even during a client call.
Want to get started with AI Agents? CARTO Academy has a dedicated Agentic GIS section with step-by-step tutorials.
Trend 3: Real-time data pipelines are replacing manual workflows
The biggest operational bottleneck for OOH data teams isn't analysis — it's getting data ready for analysis. Mobility feeds, campaign performance data, and inventory updates often live in separate systems, stitched together manually by analysts who should be focused on insights instead.
billups faced exactly this challenge. As the world's largest independent Out-of-Home technology and services company, they needed to scale their operations globally while keeping campaign insights fast and client storytelling compelling. Two things had to change: manual data integration workflows needed to become automated, and their teams needed a way to work with real-time mobility data without relying on engineering support for every new deliverable.
By deploying CARTO, billups built automated pipelines that ingest mobility data on a schedule, keeping client-facing dashboards current and freeing analysts from maintenance work. The result: faster campaign insights, more compelling client deliverables, and enhanced upsell effectiveness across 12 countries, with both technical and non-technical users able to turn geospatial data into client-ready outputs independently.
This is the shift OOH data teams are making across the board: from one-off exports and manual refreshes to scheduled Workflows that keep inventory scoring, audience analysis, and performance reporting continuously updated.
Want to see how to build this kind of pipeline for OOH? CARTO Academy's tutorial Identify the best billboards and stores for a multi-channel product launch campaign walks through building a Workflow that connects inventory data, mobility signals, and spatial analysis into a repeatable, automated process. For a deeper look at the business impact, read how billups transforms OOH media strategy with Location Intelligence.
Making location data usable for OOH
The OOH industry's data challenge was never really about having enough data. It was about making location data usable: fast enough to drive decisions, visual enough to tell a client story, and governed enough to scale across a global team.
If you're building that capability at your OOH company or agency, we'd love to show you what it looks like in practice.