What Online Retailers Can Learn by Mapping Sales Data
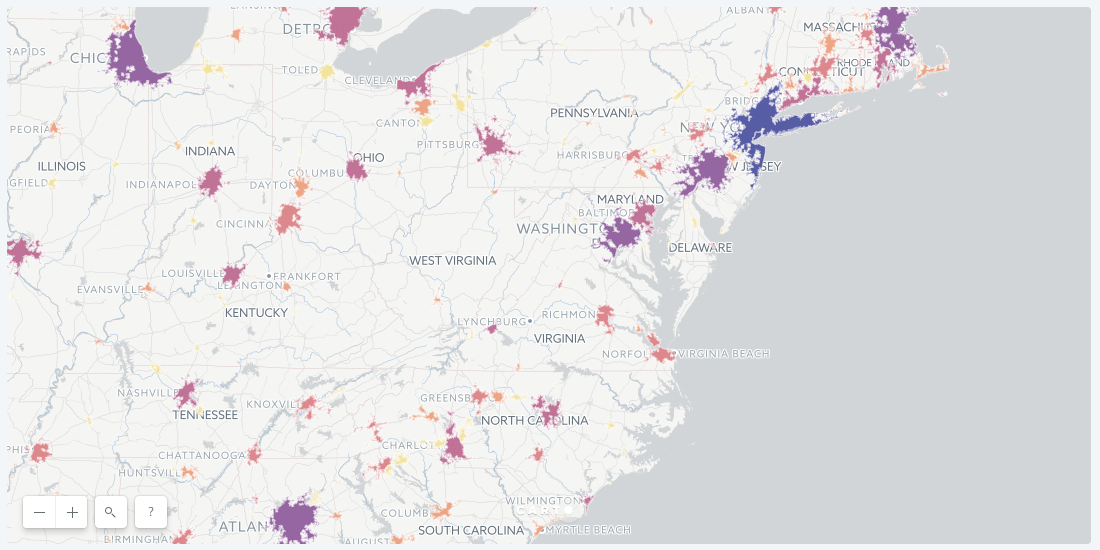
One online retailer based out of New York City was able to measure ROI of their ad campaigns by mapping sales and ad location data.

Visualizing the Olympics: Top Maps and Data Visualizations from Pyeongchang

Vision Zero in the New Era of Location Data Streams
Bringing together different location data streams provides a modern alternative to traditional traffic impact studies. In this post we’ll present what value different types of location data add to mobility analysis.

Using Spatial Interaction Models to Predict Behaviors
A spatial interaction model is specifically used to map and model the interactivity between various factors in distinct locations. This makes it extremely useful to understanding any data you might have with more than one location component.

Using Mapbox Vector Tiles in CARTO for Maps & Location Apps

Using Location Data to Identify Communities in Williamsburg, NY
We wanted to explore how we can use data to better understand and define communities of people, going beyond spatial borders like zip code and neighborhood boundaries.

Three Ways Retailers Increase Revenue with Location Intelligence
Retailers are gaining more and more data about their customers, but making informed business decisions with that data has proven difficult and expensive.

This map shows the communities most vulnerable to Hurricane Irma
We created this map in hopes that public officials and relief organizations can identify the most at-risk neighborhoods and deliver them life-saving resources before and after this disaster strikes.


