


Enhancing Spatial Analytics in BigQuery with CARTO


At CARTO we firmly believe that the future of geospatial analysis lies in the realm of next generation cloud data warehouses. Traditional data sources (such as census data or survey data) are rapidly being replaced by vast volumes of ever-changing real-time data streams from multiple sources and that is pushing the requirements of computing engines to perform spatial analytics at a scale never seen before.
But it is not only a matter of scalability. Platforms like Google BigQuery provide significant cost savings with their compute-storage separation and support for SQL. With SQL as the lingua franca for analytics we believe it will democratize access to many analytical capabilities in the future and in the GIS world this trend is clear and unstoppable. This began almost 20 years ago with PostGIS and is now migrating over to cloud native platforms.

BigQuery was the first of these cloud data warehouses to add spatial support to their engine back in 2018 opening the door to move more and more spatial workflows there. However it still lacks some of the analytical capabilities required for many geospatial use cases. Based on the work from The Urban Analytics Lab we can see a comparison of the number of geospatial functionalities compared to PostGIS.
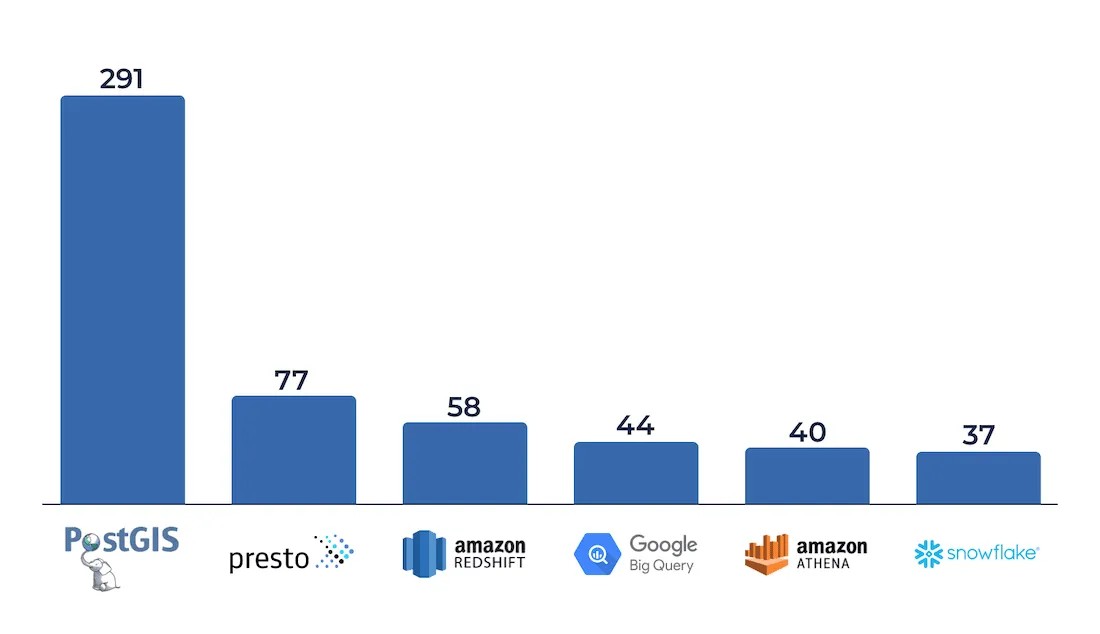
Building upon the Urban Analytics Lab’s initial study we have collated a more complete and up-to-date view of the available geospatial functions across platforms. The results of this study can be found here.
In 2019 we introduced a preliminary set of spatial functions for BigQuery through the Open Source project jslibs. But we always knew this was just the beginning. So many more functions and capabilities are needed to make a data warehouse a complete and foundational Spatial Analytics engine. We have already added capabilities to create tilesets in BigQuery, and we are now excited to announce the expansion of those capabilities.
Introducing the CARTO Spatial Extension for BigQuery
Imagine you could run this simple command:
SELECT ST_GETPOPULATIONDENSITY(ST_GEOGPOINT(-75.0 40.7)) To compute the population density anywhere in the world. Or combine two datasets simply by doing a JOIN:
SELECT table1.var table2.var table1.h3id FROM table1 JOIN table2 ON table1.h3id=table2.h3id; With our Spatial Extension for BigQuery this is possible and straight out of your BigQuery console. CARTO’s Spatial Analytics in BigQuery is packed with functions and procedures to perform geospatial analysis through expressive and simple SQL, all natively within the data warehouse environment.
Want to try out the CARTO Spatial Analytics in BigQuery?
A multilayered approach with an Open Core
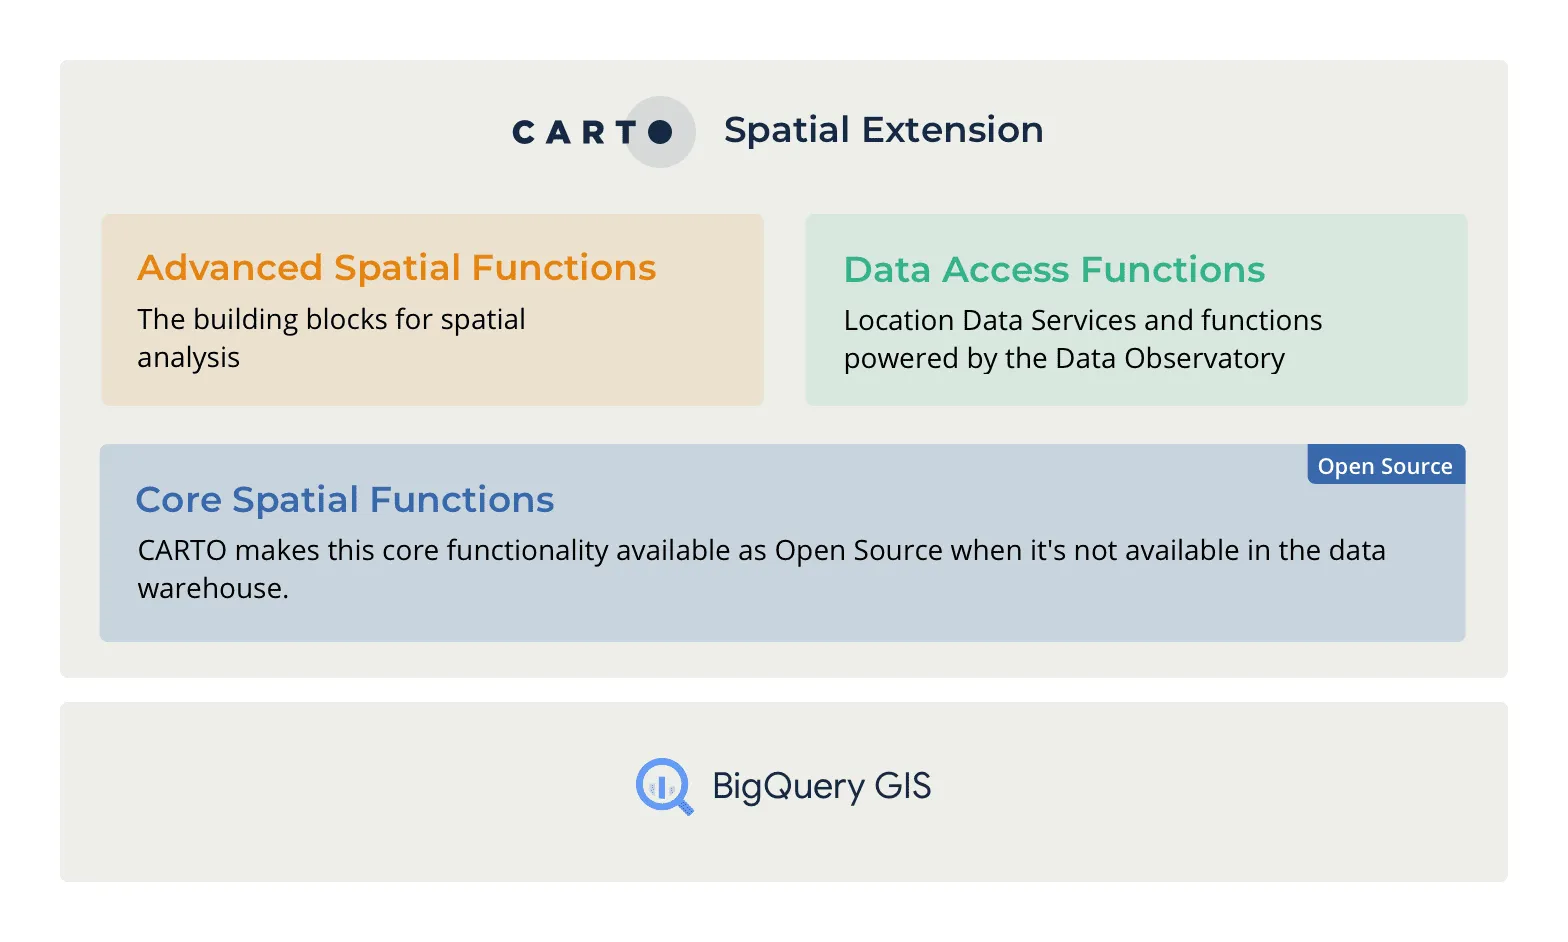
The core layer of CARTO’s Spatial Analytics in BigQuery which enhances the built-in GIS capabilities of the cloud data warehouses is open source and freely available on GitHub. With this core, we are making a set of functions available to the general public which we believe are the foundation for the next generation of spatial analytics providing support for key spatial indices such as H3 and quadkeys. For more detailed information, check out our website.
As an open source core, we actively welcome contributions and love pull requests, so if you would like to contribute specific functions or help us to debug them, we will see you on GitHub!
Advanced analytics and visualization
The Spatial Extension is already equipped with our BigQuery Tiler, a unique solution to visualize massive spatial datasets hosted in BigQuery. We are now working to develop out-of-the-box advanced spatial analysis and tools such as the identification of hotspots the computation of twin areas or performing a spatial cross validation. You can see a sample of what’s possible when we combine the power of cloud-native visualization and analytics in the making of our vaccination progress application.
Powered by our Data Observatory
Modern spatial analytics is all about connectivity to data sources, which is why we continue to grow the largest spatial data catalog out there: the CARTO Data Observatory. Take the example of a function to determine a catchment area. You can do this simply by using a buffer around a point or with a function that uses a human mobility dataset “under the hood”.
By leveraging our huge catalog of curated data, CARTO’s Spatial Analytics in BigQuery not only streamlines your analysis workflows, but also opens up a limitless array of analytical possibilities, from enriching your data with a simple SQL command to creating complex machine learning models.
Available today for BigQuery
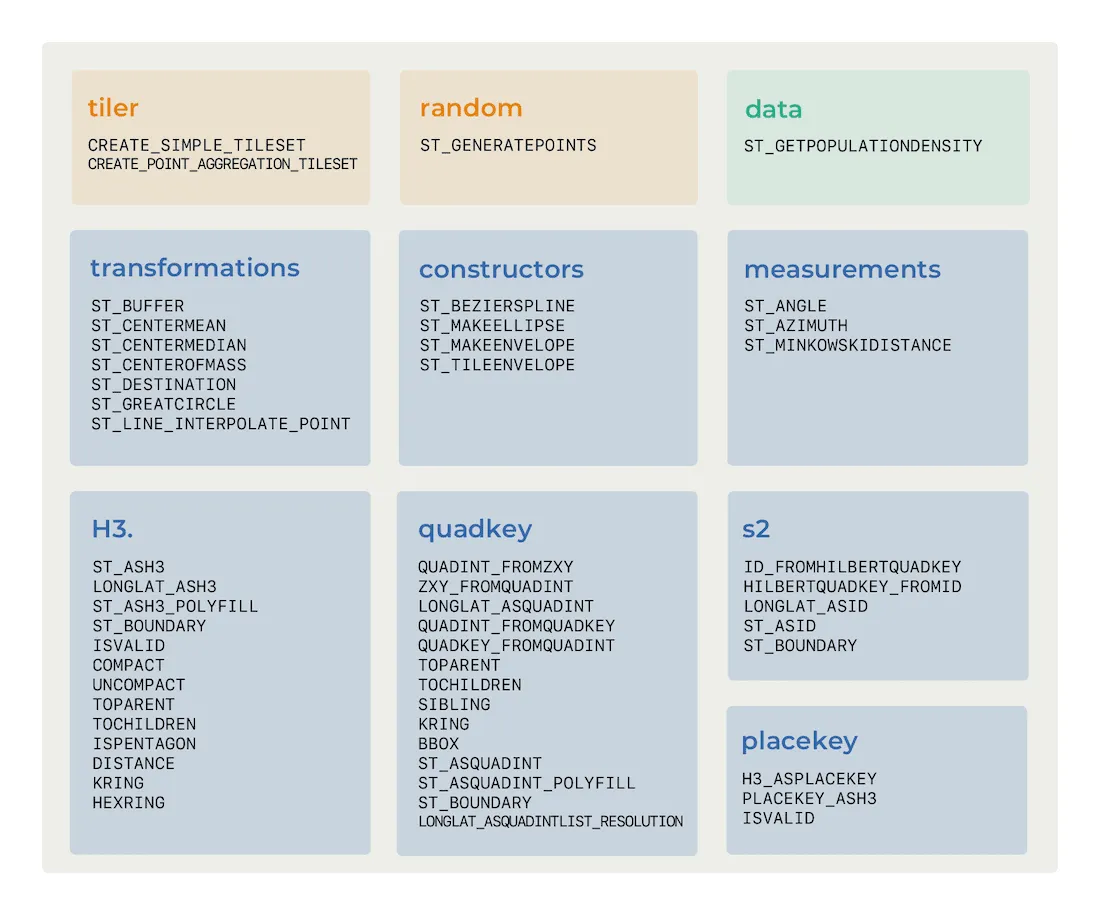
Today we are announcing the availability of more than 50 spatial functions organised in ten different modules, seven of them Open Source and free to use for anyone with a BigQuery account. These functions enhance BigQuery GIS capabilities with geometry constructors transformations and measurements support for H3 and Quadkey and the Tiler among others. A complete list of the functions can be viewed here. And best of all these functions can be used directly with your BigQuery hosted data without the need for painful ETL processes.
Thanks to BigQuery’s flexible permissions system, we are able to make the core modules of CARTO’s Spatial Analytics in BigQuery available as a public database. Therefore these functions are freely available to query from your BigQuery console without the need for any installation. To test this simply type the following SQL statement on your BigQuery console:
bqcarto.h3.VERSION() ** Please use bqcartoeu instead of bqcarto if your account is located in the European multi region.
If you would like to get access to the complete suite of modules please sign up here. We will be adding new functions every week!
Unlock the power of spatial indices
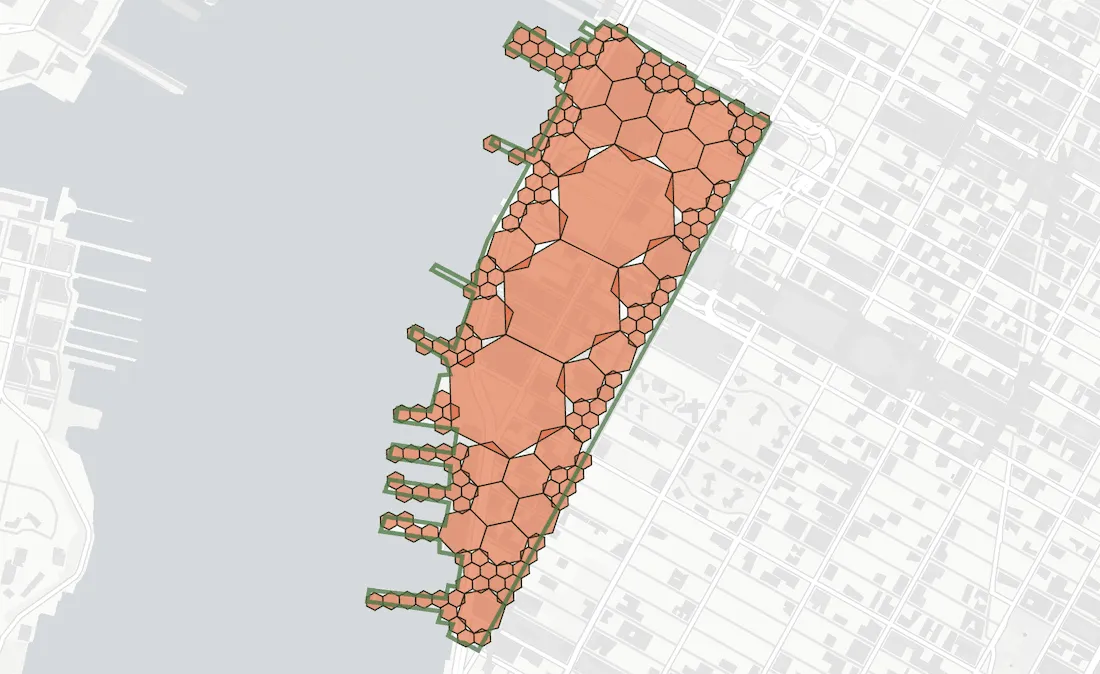
Spatial indices enable scalable analytics by partitioning the space at different resolution levels. An immediate application is the compact representation of an arbitrarily complex geometry, such as a census tract in the US with a set of indices:
WITH data as (
SELECT bqcarto.h3.COMPACT(
bqcarto.h3.ST_ASH3_POLYFILL(geom 11)) as geo
FROM carto-do-public-data.carto.geography_usa_censustract_2019
WHERE geoid=‘36061009900’)
SELECT bqcarto.h3.ST_BOUNDARY(h3) as geom FROM data UNNEST(geo) as h3 Using these simplified representations we can transform traditionally expensive operations like spatial intersections, into computationally efficient array operations. See here an example and the full script to reproduce it:
– Declare variables to hold quadkey indices
DECLARE buffer_idxs ARRAY
– Quadint representation of buffer SET buffer_idxs = ( SELECT bqcarto.quadkey.ST_ASQUADINT_POLYFILL(geom 20) as qks FROM ( SELECT bqcarto.transformations.ST_BUFFER(ST_GEOGPOINT(-73.9551819 40.7455594) 0.4 ‘kilometers’ 20) AS geom) );
– Quadint representation of census tract
SET tract_idxs = (
SELECT bqcarto.quadkey.ST_ASQUADINT_POLYFILL(geom 20) as qks
FROM carto-do-public-data.carto.geography_usa_censustract_2019
WHERE geoid=‘36081000700’
);
– Intersection SELECT qk_b FROM UNNEST(buffer_idxs) AS qk_b WHERE qk_b IN (SELECT qk_t FROM UNNEST(tract_idxs) AS qk_t)
Finally, you can see how easy it is to create a heatmap representations in this example, Starbucks locations in the US using an H3 grid. If you require an analysis at a finer scale, you simply need to choose a higher resolution when calling these functions.
WITH data AS ( SELECT bqcarto.h3.ST_ASH3(geog 4) AS h3id COUNT(*) AS agg_total FROM `carto-docs.examples.starbucks-locations-usa` GROUP BY h3id ) SELECT h3id agg_total bqcarto.h3.ST_BOUNDARY(h3id) AS geom FROM data For a comprehensive list of the functions and procedures available, as well as a set of guides and examples to help you get started, please [refer to our Documentation Center](https://docs.carto.com/spatial-extension-bq/).Our vision is to enable Spatial Analytics in SQL
Building on our success with the BigQuery Tiler today’s announcement further demonstrates our commitment to cloud native spatial analytics. We firmly believe that the future of geospatial analysis and application development is in the cloud and that SQL will rapidly become the lingua franca for advanced geospatial analytics. These are dynamic exciting times for Location Intelligence. We will be announcing further cloud native developments in the coming weeks so stay tuned for regular updates from us!
Want to find out more?
Don’t forget to share this post on Linkedin!