Accessing Demographic Clusters with CartoDB's Segmentation Layers


The U.S. Census is an amazing resource of data and information. The U.S. Census performs a number of regular as well as ongoing surveys that document many facets of people and life in the U.S. These data can often be used to help learn about dimensions of a location and what it might contain.
As humans though when asked about what a neighborhood is like we don't rhyme off a series of census variables for that neighborhood. Instead whether it be the hipsters of Williamsburg or the stroller traffic jams of Noe Valley we tend to describe neighborhoods in terms of archetypes that we can more easily relate to. These kinds of neighborhood descriptions can add meaningful value and context to your location data.
We want to make this kind of contextual data available and easier to use in CartoDB.
Releasing segmentation layers
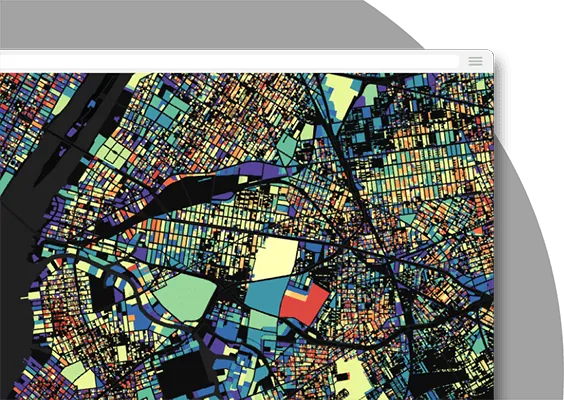
Today we are releasing inside the Data Observatory a new set of layers created from demographic segmentation. Demographic segments provide a kind of grouping of people that we then apply a data-driven naming method that makes them easily readable and recognizable when analyzing your data. By releasing them in the Data Observatory we are making them available for users to use for augmenting their own data quickly.
The segmentation is generated through a clustering procedure that we'll cover in more depth in a forthcoming blog post. The output gives us two granularities of clustering one that produces 10 unique groupings of people across the USA and a second that creates 55 unique groupings of people.
10 cluster resolution
To generate these clusters we used the algorithum proposed by Spielman and Singleton and for the x10 clusters we were able to adopt their naming structure.
The names of the 10 different neighborhood types are:
| Hispanic and kids |
| <div style=“float:left;margin-right:10px;width:20px; height:20px; border-radius:20px;background: #52bca3”>Low Income and Diverse |
| <div style=“float:left;margin-right:10px;width:20px; height:20px; border-radius:20px;background: #e58606”>Middle income single family homes |
| <div style=“float:left;margin-right:10px;width:20px; height:20px; border-radius:20px;background: #99C945”>Native American |
| <div style=“float:left;margin-right:10px;width:20px; height:20px; border-radius:20px;background: #5d69b1”>Low income minority mix |
| <div style=“float:left;margin-right:10px;width:20px; height:20px; border-radius:20px;background: #24796c”>Old Wealthy White |
| <div style=“float:left;margin-right:10px;width:20px; height:20px; border-radius:20px;background: #764e9f”>Residential institutions young people |
| <div style=“float:left;margin-right:10px;width:20px; height:20px; border-radius:20px;background: #ed645a”>Wealthy Nuclear Families |
| <div style=“float:left;margin-right:10px;width:20px; height:20px; border-radius:20px;background: #c23a7e”>Low Income African American |
| <div style=“float:left;margin-right:10px;width:20px; height:20px; border-radius:20px;background: #cc61b0”>Wealthy urban and kid-free |
55 cluster resolution
The 55 cluster layer was more difficult as the names of each group had not been previously published. For these more detailed categories we generated names based on the dominant traits of the populations within that cluster (or the dominant omission in a few cases). For example if an area within a city population is found to be highly dominated by college age adults with some college education it was given the name "City center university campuses".
Take a look at all 55 proposed group names:
| Middle Class educated suburban mixed race |
| Low income on urban periphery |
| Suburban young and low-income |
| Low-income urban young unmarried |
| Low education mainly suburban |
| Young working class and rural |
| Low income with gentrification |
| <div style=“float:left;margin-right:10px;width:20px; height:20px; border-radius:20px;background: #52BCA3”>High school education long commuters Black White Hispanic mix |
| <div style=“float:left;margin-right:10px;width:20px; height:20px; border-radius:20px;background: #66c5ae”>Rural bachelors or college degree rent/owned mix |
| <div style=“float:left;margin-right:10px;width:20px; height:20px; border-radius:20px;background: #79cdb7”>Rural high school education owns property |
| <div style=“float:left;margin-right:10px;width:20px; height:20px; border-radius:20px;background: #8bd5c1”>Young city based renters in sparse neighborhoods low poverty |
| <div style=“float:left;margin-right:10px;width:20px; height:20px; border-radius:20px;background: #5D69B1”>Predominantly black high high school attainment home owners |
| <div style=“float:left;margin-right:10px;width:20px; height:20px; border-radius:20px;background: #7b83c6”>White and minority mix multilingual mixed income / education married |
| <div style=“float:left;margin-right:10px;width:20px; height:20px; border-radius:20px;background: #9095d2”>Hispanic/Black mix multilingual high poverty renters uses public transport |
| <div style=“float:left;margin-right:10px;width:20px; height:20px; border-radius:20px;background: #a3a7df”> Predominantly black renters rent / own mix |
| <div style=“float:left;margin-right:10px;width:20px; height:20px; border-radius:20px;background: #E58606”>Lower middle income with higher rent burden |
| <div style=“float:left;margin-right:10px;width:20px; height:20px; border-radius:20px;background: #f0983b”>Black and mixed community with rent burden |
| <div style=“float:left;margin-right:10px;width:20px; height:20px; border-radius:20px;background: #f4a24e”>Lower middle income with affordable housing |
| <div style=“float:left;margin-right:10px;width:20px; height:20px; border-radius:20px;background: #f8ab5f”>Relatively affordable satisfied lower middle class |
| <div style=“float:left;margin-right:10px;width:20px; height:20px; border-radius:20px;background: #fcb470”>Satisfied lower middle income higher rent costs |
| <div style=“float:left;margin-right:10px;width:20px; height:20px; border-radius:20px;background: #ffbe81”>Suburban/rural satisfied decently educated lower middle class |
| <div style=“float:left;margin-right:10px;width:20px; height:20px; border-radius:20px;background: #ffc792”>Struggling lower middle class with rent burden |
| <div style=“float:left;margin-right:10px;width:20px; height:20px; border-radius:20px;background: #ffd0a3”>Older white home owners less comfortable financially |
| <div style=“float:left;margin-right:10px;width:20px; height:20px; border-radius:20px;background: #ffdab4”>Older home owners more financially comfortable some diversity |
| <div style=“float:left;margin-right:10px;width:20px; height:20px; border-radius:20px;background: #2F8AC4”>Younger poorer single parent family Native Americans |
| <div style=“float:left;margin-right:10px;width:20px; height:20px; border-radius:20px;background: #77b8ee”>Older middle income Native Americans married and educated |
| <div style=“float:left;margin-right:10px;width:20px; height:20px; border-radius:20px;background:#24796C”>Older mixed race professionals |
| <div style=“float:left;margin-right:10px;width:20px; height:20px; border-radius:20px;background:#388d7e”>Works from home highly educated super wealthy |
| <div style=“float:left;margin-right:10px;width:20px; height:20px; border-radius:20px;background:#4ca191”>Retired grandparents |
| <div style=“float:left;margin-right:10px;width:20px; height:20px; border-radius:20px;background:#60b5a5”>Wealthy and rural living |
| <div style=“float:left;margin-right:10px;width:20px; height:20px; border-radius:20px;background:#73c9b8”>Wealthy retired mountains/coasts |
| <div style=“float:left;margin-right:10px;width:20px; height:20px; border-radius:20px;background:#87decc”>Wealthy diverse suburbanites on the coasts |
| <div style=“float:left;margin-right:10px;width:20px; height:20px; border-radius:20px;background:#9bf3e1”>Retirement communities |
| <div style=“float:left;margin-right:10px;width:20px; height:20px; border-radius:20px;background:#c23a7e”>Urban - inner city |
| <div style=“float:left;margin-right:10px;width:20px; height:20px; border-radius:20px;background:#d86298”>Rural families |
| <div style=“float:left;margin-right:10px;width:20px; height:20px; border-radius:20px;background:#764e9f”>College towns |
| <div style=“float:left;margin-right:10px;width:20px; height:20px; border-radius:20px;background:#8a64b1”>College town with poverty |
| <div style=“float:left;margin-right:10px;width:20px; height:20px; border-radius:20px;background:#9e7ac3”>University campus wider area |
| <div style=“float:left;margin-right:10px;width:20px; height:20px; border-radius:20px;background:#b491d5”>City outskirt university campuses |
| <div style=“float:left;margin-right:10px;width:20px; height:20px; border-radius:20px;background:#c9a8e8”>City center university campuses |
| <div style=“float:left;margin-right:10px;width:20px; height:20px; border-radius:20px;background:#ed645a”>Lower educational attainment homeowner low rent |
| <div style=“float:left;margin-right:10px;width:20px; height:20px; border-radius:20px;background:#ee7655”>Younger long commuter in dense neighborhood |
| <div style=“float:left;margin-right:10px;width:20px; height:20px; border-radius:20px;background:#f38060”>Long commuters White/Black mix |
| <div style=“float:left;margin-right:10px;width:20px; height:20px; border-radius:20px;background:#f98a6b”>Low rent in built up neighborhoods |
| <div style=“float:left;margin-right:10px;width:20px; height:20px; border-radius:20px;background:#fe9576”>Renters within cities mixed income areas White/Hispanic mix unmarried |
| <div style=“float:left;margin-right:10px;width:20px; height:20px; border-radius:20px;background:#ff9f82”>Older Home owners with high income |
| <div style=“float:left;margin-right:10px;width:20px; height:20px; border-radius:20px;background:#ffa98d”>Older home owners and very high income |
| <div style=“float:left;margin-right:10px;width:20px; height:20px; border-radius:20px;background:#ffb399”>White/Asian Mix big city burb dwellers |
| <div style=“float:left;margin-right:10px;width:20px; height:20px; border-radius:20px;background:#ffbda5”>Bachelors degree mid income with mortgages |
| <div style=“float:left;margin-right:10px;width:20px; height:20px; border-radius:20px;background:#ffc8b1”>Asian/Hispanic Mix mid income |
| <div style=“float:left;margin-right:10px;width:20px; height:20px; border-radius:20px;background:#ffd2bd”>Bachelors degree higher income home owners |
| <div style=“float:left;margin-right:10px;width:20px; height:20px; border-radius:20px;background:#CC61B0”>Wealthy city commuters |
| <div style=“float:left;margin-right:10px;width:20px; height:20px; border-radius:20px;background:#d975bd”>New developments |
| <div style=“float:left;margin-right:10px;width:20px; height:20px; border-radius:20px;background:#e488c9”>Very wealthy multiple million dollar homes |
| <div style=“float:left;margin-right:10px;width:20px; height:20px; border-radius:20px;background:#ee9ad4”>High rise dense urbanites |
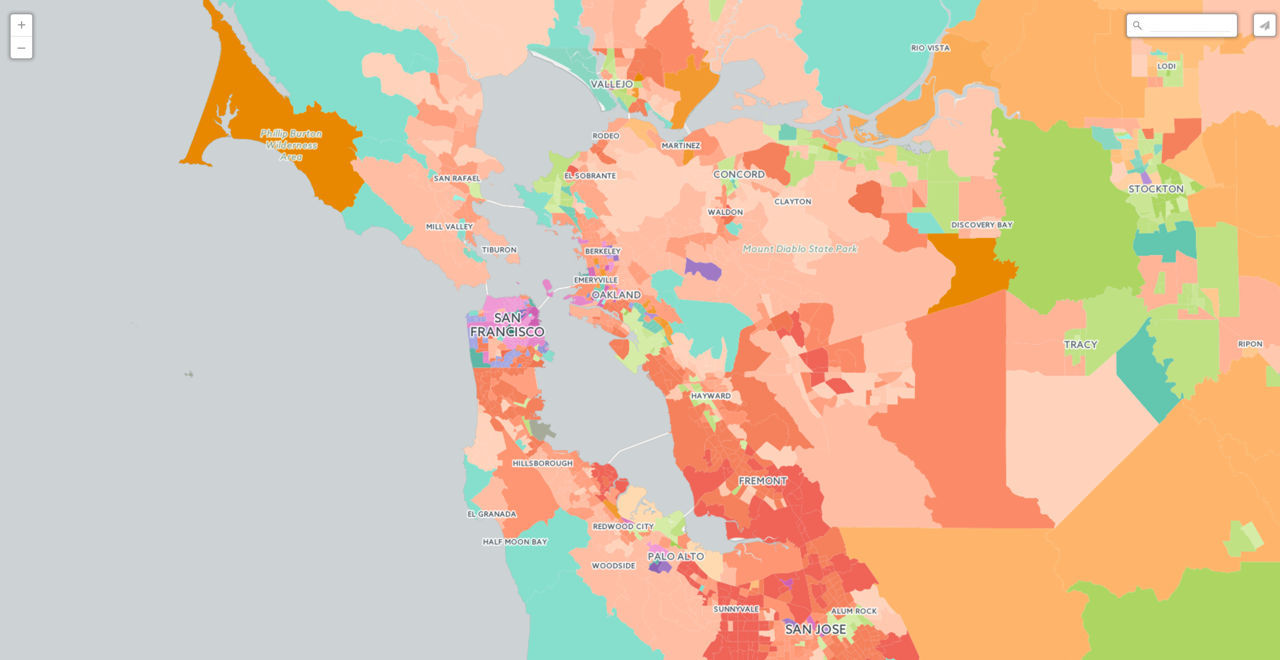
On the map
You can explore both on this map and the deep insights dashboard here or take a look at the simple map version here:
Accessing demographic segments
Using the awesome power of the Data Observatory to bring these segments into your data is as easy as calling a quick SQL statement.
To query these segments at a single point location simply use the function
10 clusters
    SELECT * FROM OBS_GetUSCensusCategory(
        CDB_LatLng(40.704512  -73.936669)
        'Spielman-Singleton Segments: 10 Clusters')
55 clusters
    SELECT * FROM OBS_GetUSCensusCategory(
        CDB_LatLng(40.704512  -73.936669)
        'Spielman-Singleton Segments: 55 Clusters')
Augmenting your data
Another interesting use of the segmentation data is to augment your tables. You can do so by adding a new column to any table called segment (or any other unique name).
Next augment your table with the segment description:
    update  your_table set segment = (
      SELECT * from OBS_GetUSCensusCategory(
        the_geom
        'Spielman-Singleton Segments: 10 Clusters'
      )
    )
    update your_table set segment = (
      SELECT * from OBS_GetUSCensusCategory(
        the_geom
        'Spielman-Singleton Segments: 55 Clusters'
      )
    )
To create similar or even better visualizations you can watch our Data Observatory webinar as many times as you need to!
Next steps
Today we wanted to announce the availability of this exciting set of layers in the Data Observatory. In future blog posts we will explore some of these groupings what they can tell us about the U.S. and how they can add context and insight into your data. We will also detail how these segments
were created and how we plan to improve and expand on them in the future.
For further reading checkout the data services-api docs and the Data Observatory.
For now happy demographic segment mapping!